MailBag August 29, 2014 at 11:51 AM
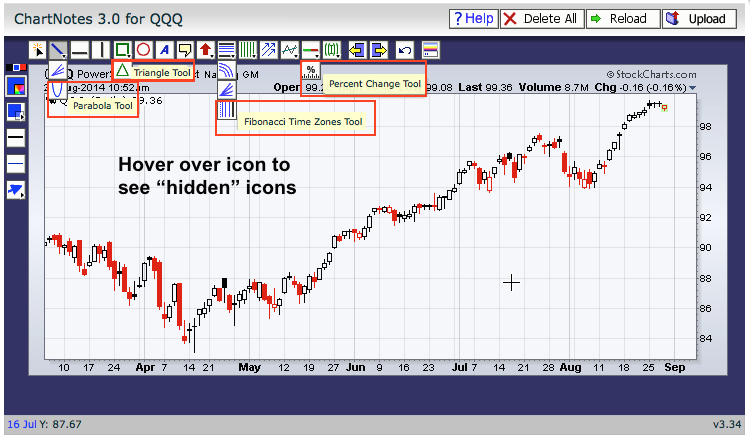
SharpCharts users can access several "hidden" annotation tools by hovering over icons that have small arrows in the right hand corner. First, create a SharpChart and click the annotate link to open the ChartNotes workbench. There is a row of annotation icons just above the chart on the left side. Some of these icons have small arrows that point to more icons just below. Simply hover over these icons to reveal the hidden gems. The example below shows four examples. First, the Parabola Tool can be found under the Trend Line icon. Second, the Triangle Tool can be found just under the Box Read More
MailBag August 22, 2014 at 04:14 AM
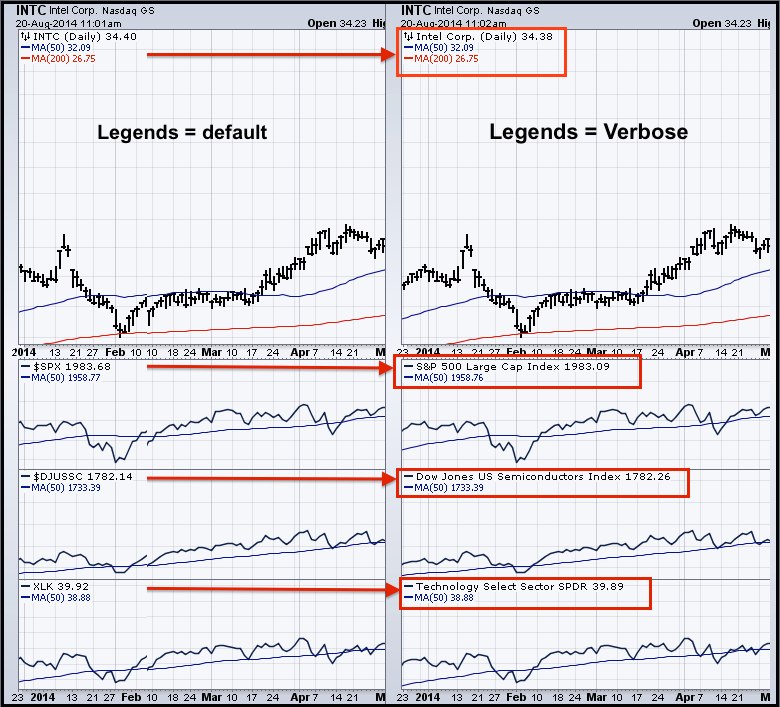
Chartists can get industry and sector information by using two pseudo symbols and setting the legends to verbose. The default setting for legends shows basic information that includes the security symbols and indicators. This setting is great for basic charting, but might not be enough when using pseudo symbols such as $INDUSTRY and $SECTOR. These symbols plot the industry group and sector associated with a stock. Note that they do not work for ETFs or indices. Chartists can add these symbols by choosing "price" as an indicator and entering $INDUSTRY or $SECTOR in the parameters box. Read More
MailBag August 15, 2014 at 06:36 AM
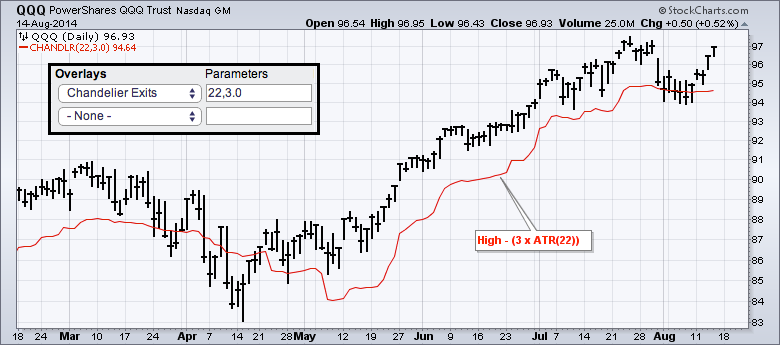
Chartists can add Chandelier Exits as an "overlay" to set a trailing stop-loss for long and short positions. Chandelier Exits are dynamic because they are based on the Average True Range (ATR), which is a measure of volatility. The default Chandelier Exit is designed to set a trailing stop-loss for long positions. A 22-period Chandelier Exit for long positions would set a trailing stop-loss three 22-period ATR values below the 22-period high. The exit will remain below prices during an uptrend and rise as the uptrend continues. A move below the Chandelier line could then act as a Read More
MailBag August 08, 2014 at 04:37 PM
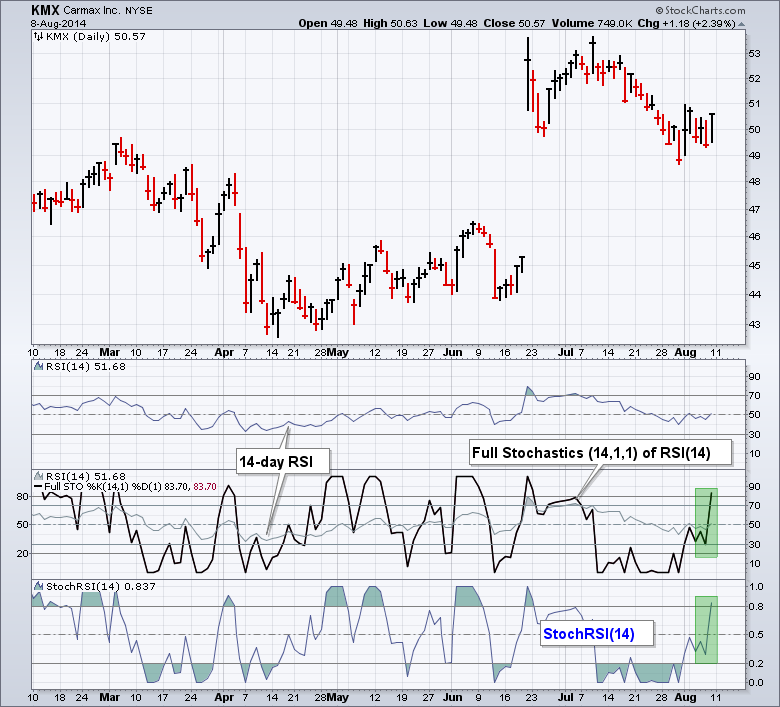
StochRSI, or Stochastic RSI, is the Fast Stochastic Oscillator applied to RSI. This makes it a momentum oscillator of a momentum oscillator. Velocity is a term that could be used to describe the momentum of momentum. The chart below shows Carmax (KMX) with RSI(14) in the first indicator window. RSI(14) and the Full Stochastic Oscillator (14,1,1) are in the middle indicator window. StochRSI(14) is in the lower indicator window. This full Stochastic Oscillator setting (14,1,1) is essentially the Fast Stochastic Oscillator. First, notice how the Stochastic Read More