|
The Slope indicator measures the slope of a linear regression, which is the line of best fit for a data series. A 20-period Slope, therefore, measures the slope of a 20-day linear regression. As you may remember from your high school math, the slope is the rise over the run for a line. Chartists can plot a linear regression using the Raff Regression Channel on the price chart. Note that the middle line of the Raff Regression Channel is the linear regression.
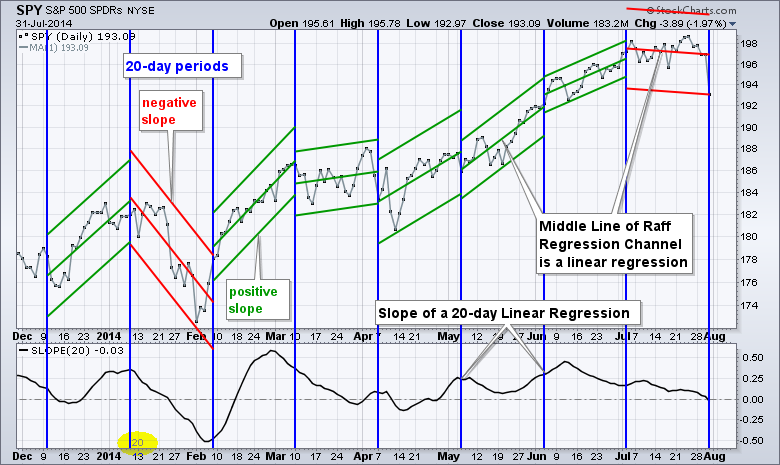
The chart below shows 20-period timeframes with the blue horizontal lines and Raff Regression Channels drawn during these timeframes. The Slope indicator is in the lower window. The Raff Regression Channel sloped down in early February and the Slope indicator was negative. The Raff Regression Channel from early February to early March rose and the Slope indicator was positive. In general, a positive slope indicates an uptrend, while a negative slope indicates a downtrend. You can read more on the Slope and the Raff Regression Channel in our ChartSchool.