MailBag September 26, 2014 at 05:24 AM
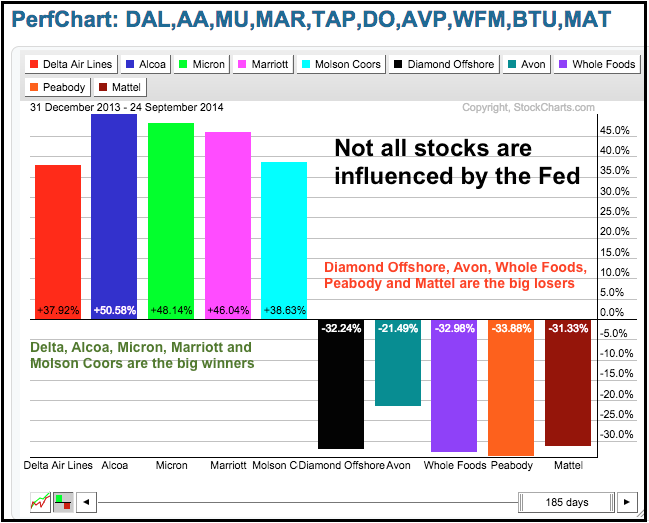
Short answer: Yes. First, it is a market of stocks, not a "stock market". It is highly unlikely that the Fed is controlling the business decisions of Delta, Alcoa, Micron, Avon, Whole Foods, Mattel and other companies. Some stocks may be more interest rate sensitive than others, but Fed policy is probably not part of the boardroom debate at most companies. The PerfChart below shows year-to-date performance for ten stocks in the S&P 500. Is the Fed responsible for this performance differential? For the most part, the stock market is made up of individual stocks with company and industry Read More
MailBag September 19, 2014 at 09:26 AM
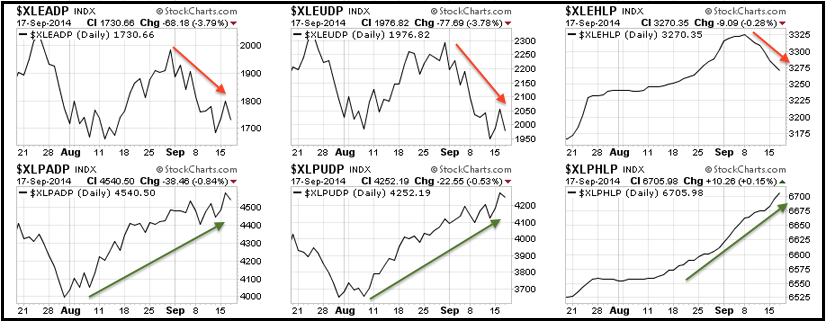
Chartists can find sector breadth charts in the CandleGlance Groups on the Free Charts page. The CandleGlance Groups can be found at the top of the middle column. Click the Sector Breadth Indexes link and you will shown 27 breadth charts covering the 9 sector SPDRs. These include the AD Line, AD Volume Line and High-Low Line. The examples below just show the AD Lines and AD Volume Lines. The screen shot above shows these indicators for the Energy SPDR (XLE) and the Consumer Staples SPDR (XLP). Right away we can see which sector is strong and which is Read More
MailBag September 18, 2014 at 10:24 AM
StockCharts is growing so quickly, there are exciting new features showing up all the time. Sometimes it takes a quick little review to show how to find things. Since the addition of DecisionPoint charts, there are lots of ticker symbols that are new. The video below will clarify how to do this quickly. If you have other questions, see our video library. Arthur has done a massive amount of work to quickly demonstrate the features. Here is the link to the Videos. Using StockCharts Videos. This link can also be found on your members Read More
MailBag September 12, 2014 at 05:29 AM
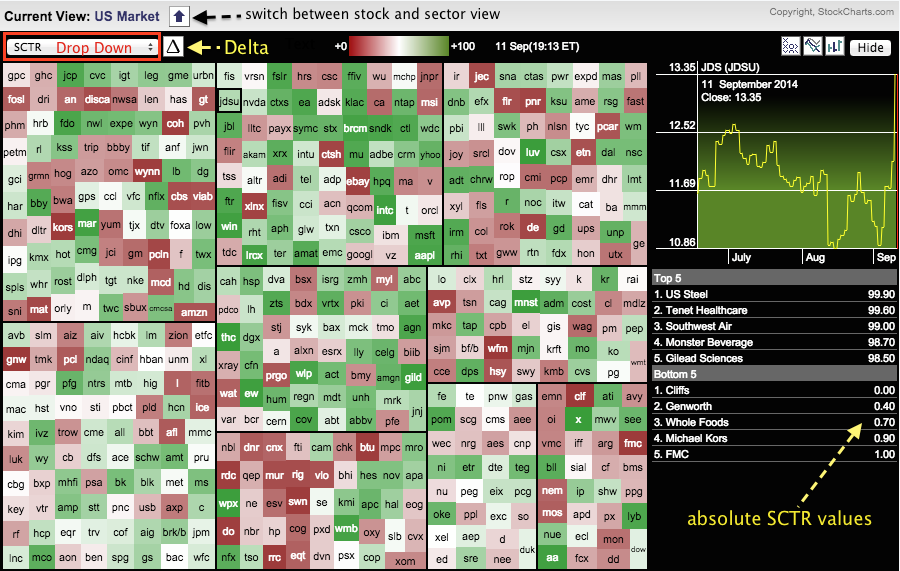
Chartists can analyze relative performance by viewing the StockCharts Technical Rank (SCTR) in a Sector Market Carpet. There are two ways to measure relative performance. First, chartists can compare the absolute SCTR values, which range from zero to one hundred. Low values (0 to 30) signal relative weakness, while high values (70 to 100) signal relative strength. Second, chartist can compare the change in SCTR values. A big gain in the SCTR signals relative strength for that period, while a big loss signals relative weakness for that period. Let's look at some examples. Read More
MailBag September 05, 2014 at 06:17 AM
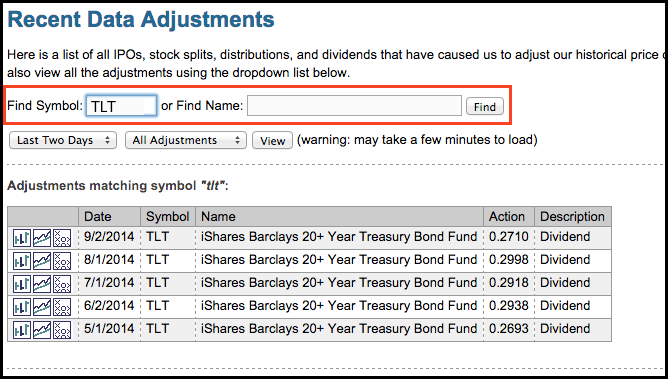
Chartists can view dividends and other price adjustments two ways. First, you can go to the "recent data adjustments" page and enter a symbol to see recent adjustments. A link to this page can be found on the right navigation column under "additional tools & reports". The example below shows the 20+ YR T-Bond ETF (TLT) with the payouts over the last four months. Notice that TLT pays a dividend every month. Second, chartists can pull up a SharpChart and select "events" as an overlay. This will add a dotted line on the event date and the amount at the bottom. This method makes Read More