|
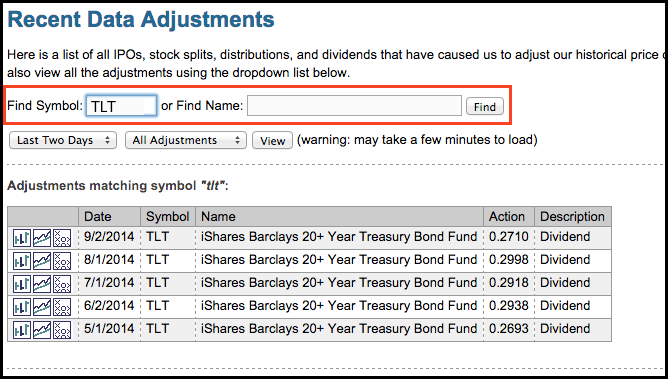
Chartists can view dividends and other price adjustments two ways. First, you can go to the "recent data adjustments" page and enter a symbol to see recent adjustments. A link to this page can be found on the right navigation column under "additional tools & reports". The example below shows the 20+ YR T-Bond ETF (TLT) with the payouts over the last four months. Notice that TLT pays a dividend every month.
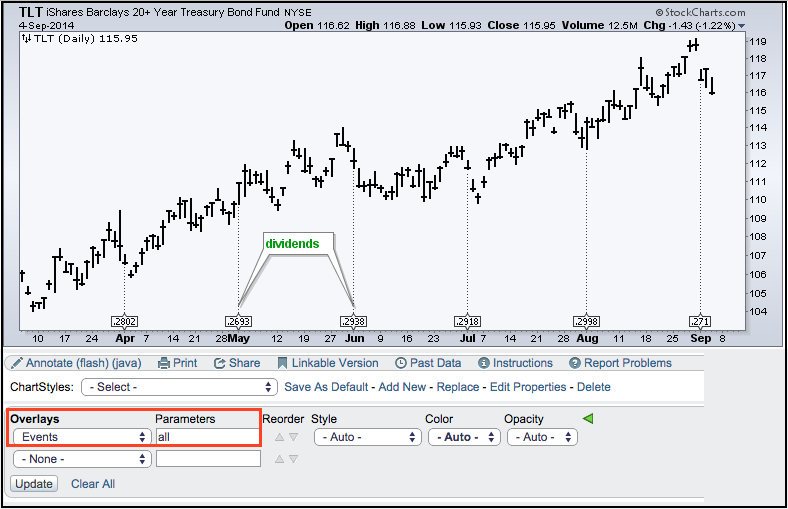
Second, chartists can pull up a SharpChart and select "events" as an overlay. This will add a dotted line on the event date and the amount at the bottom. This method makes it easy to see how often there is a payout and how much. If you would like to see a chart with unadjusted data, simply prefix the symbol with an underscore. For example, _TLT would show a TLT chart with unadjusted data.