
|
Chartists can find sector breadth charts in the CandleGlance Groups on the Free Charts page. The CandleGlance Groups can be found at the top of the middle column. Click the Sector Breadth Indexes link and you will shown 27 breadth charts covering the 9 sector SPDRs. These include the AD Line, AD Volume Line and High-Low Line. The examples below just show the AD Lines and AD Volume Lines.
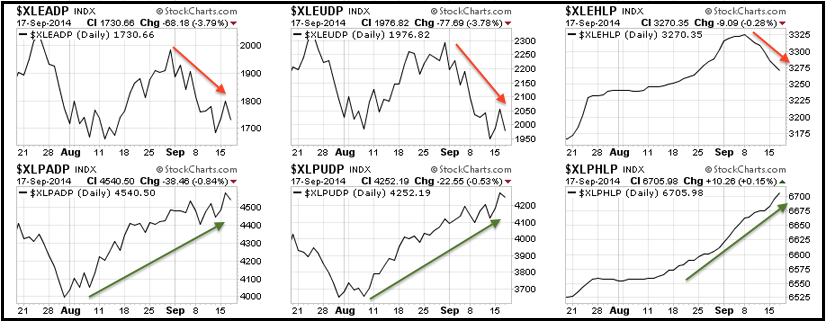
The screen shot above shows these indicators for the Energy SPDR (XLE) and the Consumer Staples SPDR (XLP). Right away we can see which sector is strong and which is weak. The AD Line, AD Volume Line and High-Low Line for the Consumer Staples SPDR hit new highs this week and remain in strong uptrends. The AD Line and AD Volume Line for the Energy SPDR (XLE) peaked in late August and moved sharply lower in September. The High-Low Line turned down last week.
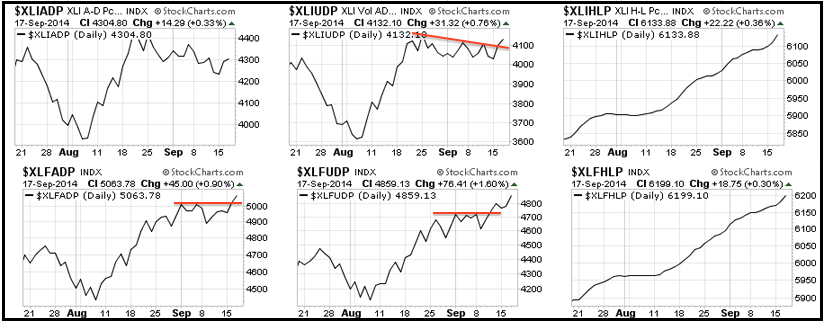
These charts can also be used to identify breadth breakouts and relative strength. The screen shot above shows the AD Line for the Industrials SPDR (XLI) breaking out with a surge above the early September highs. The Finance SPDR (XLF) is one of the strongest sectors. Notice that the AD Line broke to new highs this week and the AD Volume Line broke to new highs last week.
