A member recently wrote in asking for different ways to measure relative performance. This is a great question because relative performance is a very important piece of the investment puzzle. In addition to looking for stocks and ETFs in uptrends, chartists can improve their odds by looking for stocks and ETFs showing relative strength. StockCharts offers at least three ways to measure relative performance.
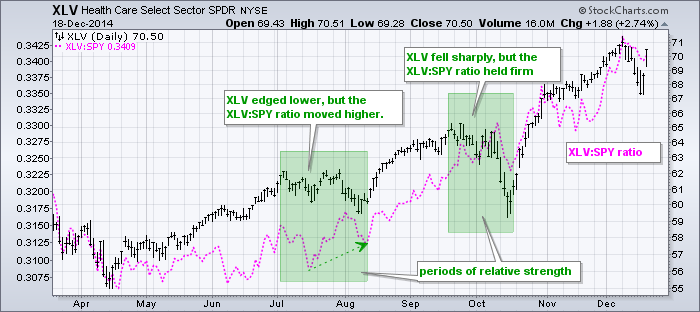
First, chartists can simply plot the price relative, which is a ratio chart that compares the performance of one symbol in terms of the other. The Consumer Discretionary SPDR (XLY) relative to the S&P 500 SPDR (SPY) would be XLY:SPY. Choose price as an indicator and enter XLY:SPY in the parameters box to plot. XLY is outperforming when the ratio rises and underperforming when the ratio falls.
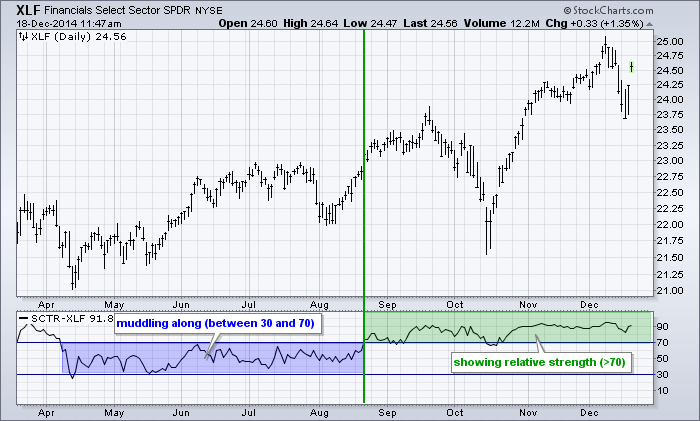
The second method uses the StockCharts Technical Rank (SCTR), which ranges from zero to one hundred. There are five different groupings: large-caps, mid-caps, small-caps, ETFs and Toronto stocks. The SCTR value represents the relative performance rank within that group. SPY would be part of the ETF group, IBM would be a large-cap and Proofpoint would be a small-cap. Low values (<30) show relative weakness and high values show relative strength (>70). Chartists can plot the SCTR by selecting it as an indicator. The chart below shows the SCTR for the Finance SPDR moving above 70 in late August and holding above 70 for most of the last four months.
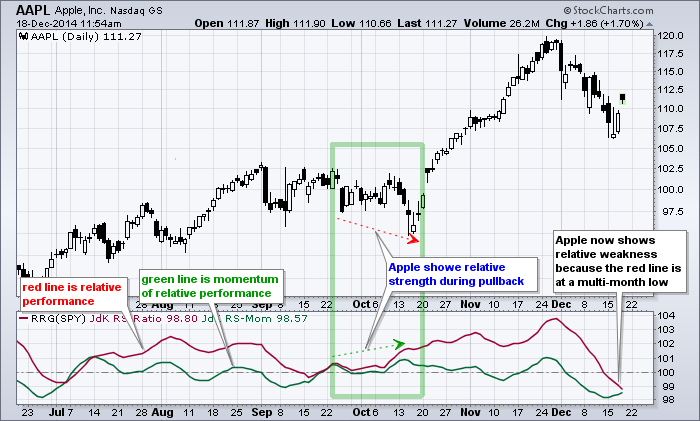
The third method uses the Relative Rotation Graph (RRG) indicator. Simply choose the indicator and select the benchmark, which is usually the S&P 500 or SPY. The example below shows Apple with SPY as the benchmark. The red line, relative performance, turned positive toward the end of September and Apple showed relative strength even as the broader market tanked in mid October. Relative strength during a market swoon is a good indicator for future price appreciation. You can read all about these indicators in our ChartSchool.

Posted by: Rose Albert December 19, 2014 at 21:38 PM
Posted by: Lynda F. December 21, 2014 at 12:04 PM