|
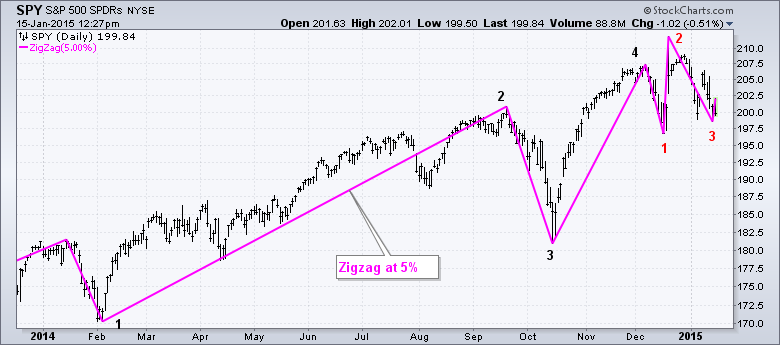
The stock market has been quite volatile in 2015 and this may be a good time to consider alternative charting techniques to filter out some of the noise. The chart below shows the S&P 500 SPDR with the zigzag indicator set at 5%, which filters out price swings that are less than 5%. There were four 5+ percent swings in the first eleven months of 2014 and three 5+ percent swings in December-January. Clearly, market volatility is heating up.
While volatility may be fine for day traders, it can make the chart noisy for position traders and investors. Fortunately, there are charting options to filter out some of this noise. Today I will show a Japanese technique and a new twist on a classic technique.
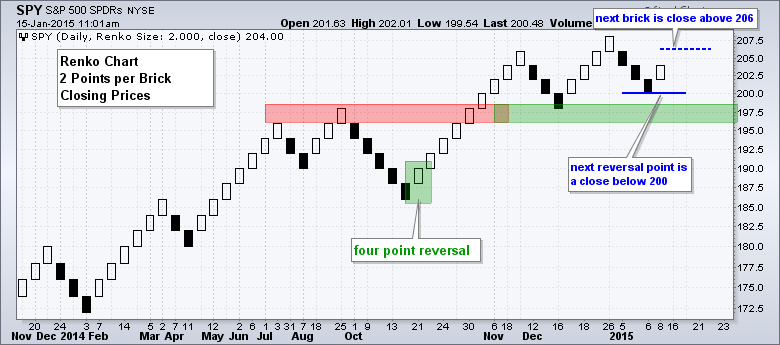
First up, Renko charts use price "bricks" to filter noise. The example below shows a 2-point Renko chart based on closing prices. Each "brick" is two points and it takes a four point reversal to change direction. This reduces noise in two ways. First, it is a close only chart so we do not use the intraday high and low. Second, setting the brick size at two points filters out all price moves less than two points. This means that price moves less than 2 points are ignored, which is why the date axis is irregular. The day is simply skipped if the price change is less than 2 points.
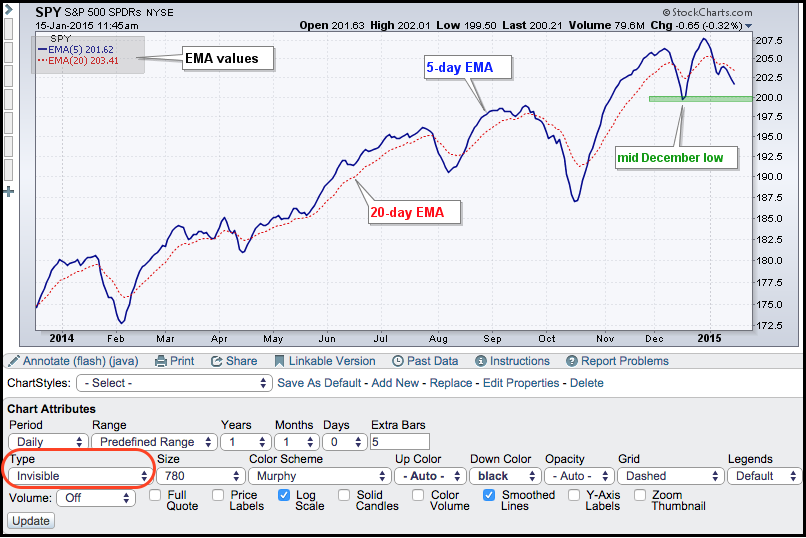
The second method is to smooth prices with a moving average. Instead of plotting SPY with the moving average, however, we are going to make it invisible and just chart two moving averages. The example below shows the 5-day EMA and 20-day EMA for SPY. I removed SPY from the chart by selecting "invisible" as chart "Type" in the "Chart Attributes" section. This chart paints a different picture than the one above. Notice that the 5-day EMA moved below the 20-day EMA on 6-Jan and remains below. Also notice that both EMAs are falling. The mid December low appears to mark the next key level, a break of which would forge a lower low in the 5-day EMA. Note that moving average crossover systems are notorious for whipsaws. I would, therefore, just use these moving averages to get a sense of direction.