MailBag February 27, 2015 at 02:48 PM

StockCharts users can do a simple database search to find symbols for 10-year government bond yields for the United States, Germany, Japan and the UK. Go to the symbol catalog and enter "yield and 10" (without quotation marks). The "and" means that both words are required in the results. Users could also search for "yield and indx" to see all of our index symbols related to yields. The term "indx" insures that an index symbol will show up in the results. Chartists can plot these yields on the same chart using the "price - same scale" Read More
MailBag February 20, 2015 at 09:26 AM
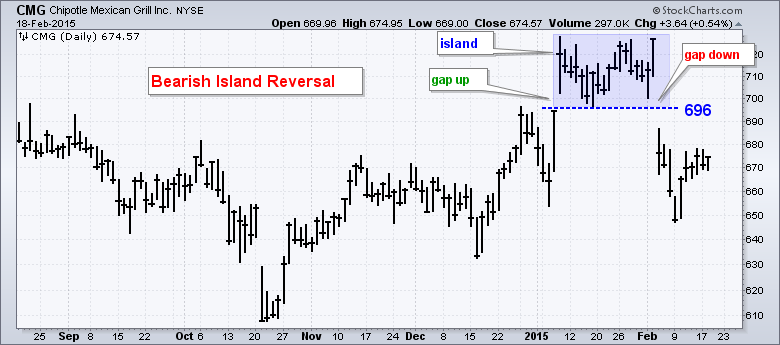
An island reversal is a reversal pattern that forms with two gaps and price action in between the two gaps. These gaps tell us that the island reversal marks a sudden, and sharp, shift in direction. Even though they are relatively uncommon, island reversals are potent patterns that warrant our attention. The alignment of the gaps holds the key. First, note that a bullish island reversal forms with a gap down and then a gap up. A bearish island reversal forms with a gap up and then a gap down. These gaps overlap to create an island of price action, hence the term "island Read More
MailBag February 13, 2015 at 01:58 PM
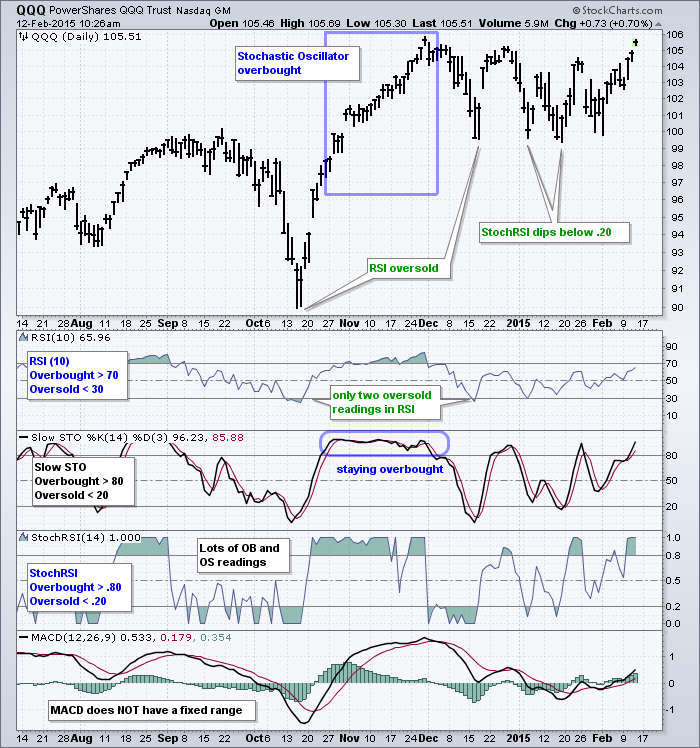
In general, momentum oscillators with a fixed range are best suited for identifying overbought and oversold conditions. These include RSI, the Stochastic Oscillator and StochRSI. RSI and the Stochastic Oscillator fluctuate between zero and one hundred, while StochRSI fluctuates between zero and one. Momentum oscillators like MACD and the Percentage Price Oscillator (PPO) do not have fixed ranges and this makes it more difficult to identify overbought and oversold conditions. The QQQ chart below shows RSI(10), the Slow Stochastic Oscillator (14) Read More
MailBag February 06, 2015 at 04:33 PM
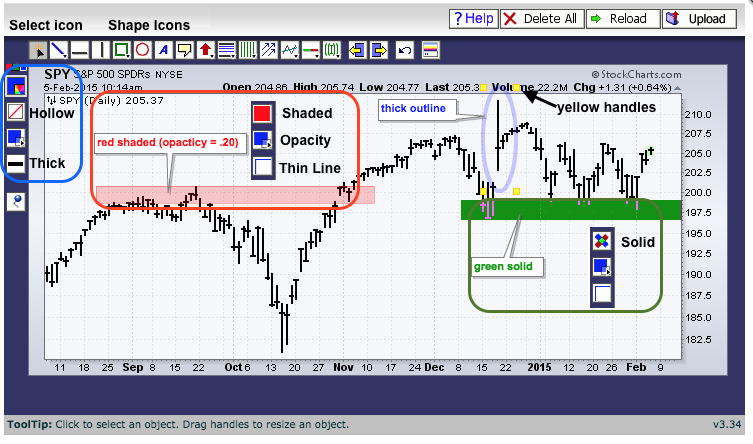
Once a shape is drawn on a SharpChart, chartists can use the "fill mode" and "opacity" settings to highlight the shape. This is a great way to draw support or resistance zones on charts, or to highlight a consolidation. Here are the steps: 1. Create a SharpChart and open the ChartNotes workbench to annotate. 2. Select a shape from the icon row at the top left. 3. Move to your starting point and click-drag to draw shape. 4. Now use the tools on the vertical icon bar on the Read More