 Welcome to our first recap of Wednesday's MarketWatchers LIVE show. Information abounds in our Monday/Wednesday/Friday 12:00p - 1:30p shows, but we will try to incorporate the charts that you found the most interesting during the show (or that we find most interesting!). This is still a work in progress so this blog will take shape as we go along. Your comments and suggestions are welcome. Our Twitter handle is @MktWatchersLIVE, Email is marketwatchers@stockcharts.com and our Facebook page is up and running so "like" it at MarketWatchers LIVE.
Wednesday's Topics:
Market Updates: We have three market updates during our 1 1/2 hour show. During these updates Erin goes over current market conditions, big movers, indicators and sector overviews. Below are a few DecisionPoint indicator charts for the Dow as well as a look at the daily chart:
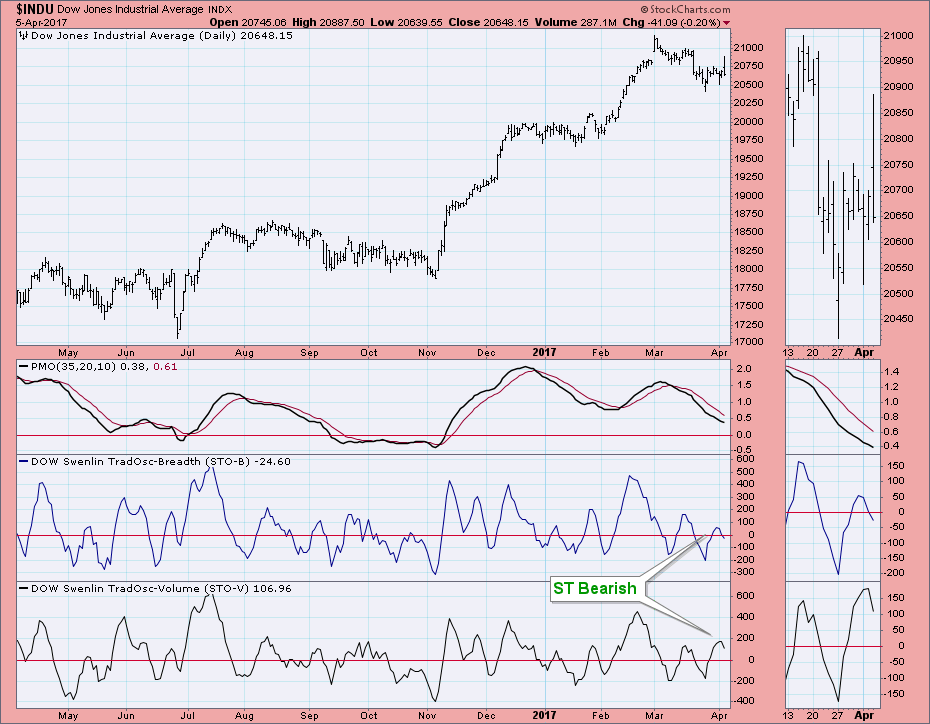
Short-Term: With both indicators topping, the short term picture is bearish for the Dow. During the show, the Dow was up well over .5% but by day's end, the picture got more gloomy.
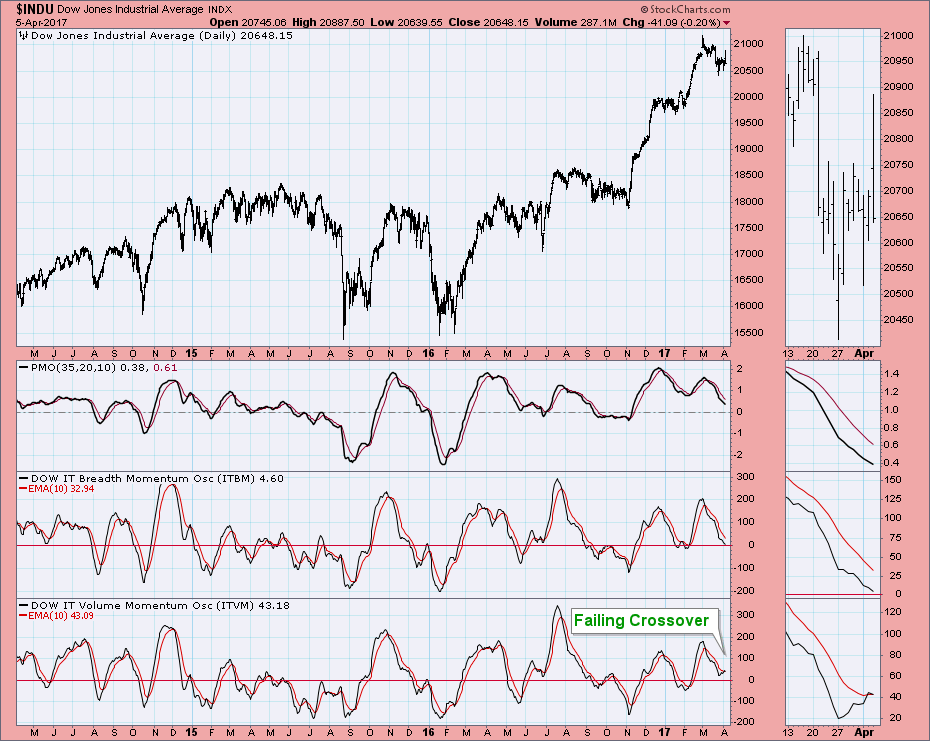
Intermediate-Term: The ITVM was looking good, but now we see the recent positive crossover is in serious jeopardy. The ITBM remained bearish, continuing lower and not looking back. This suggests internal weakness.
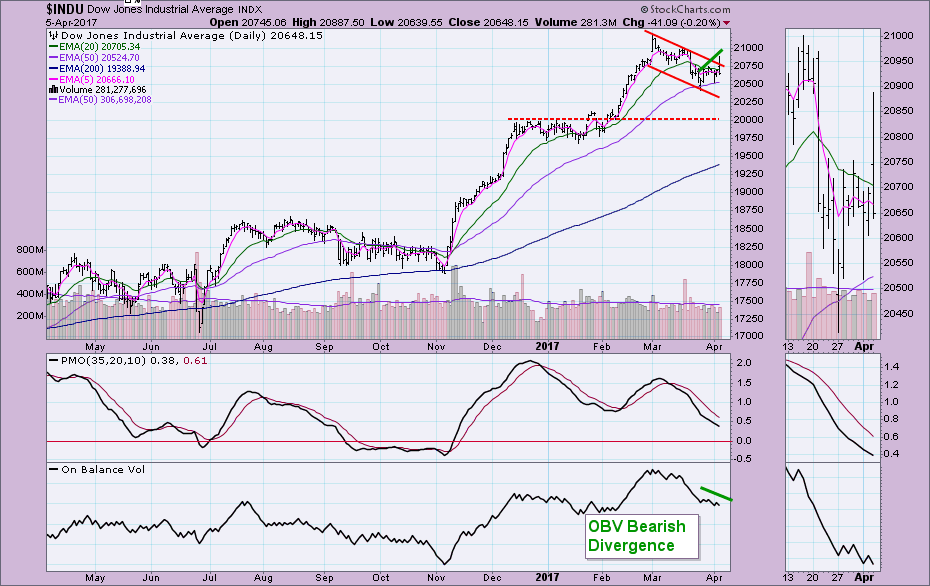
 DOW Daily Chart: There is a bearish divergence between price tops and OBV tops. The Price Momentum Oscillator (PMO) is still declining. Wednesday's breakout appeared promising but price closed out the day back in the declining trend channel.
Movers and Shakers: In this segment Tom and Erin looked at market movers for the day. The Dow looked great at the beginning of the show, but by day's end it had deflated.
Social Media/Twitter: Interaction with the show makes it more interactive, entertaining and educational. Wednesday we used Twitter to run a few polls and answer questions. Feel free to interact with us anytime. Don't forget to like our Facebook page and feel free to use our Email (marketwatchers@stockcharts.com) to get in touch. Twitter: @mktwatchers.com. Erin will be our "Social Media Maven".
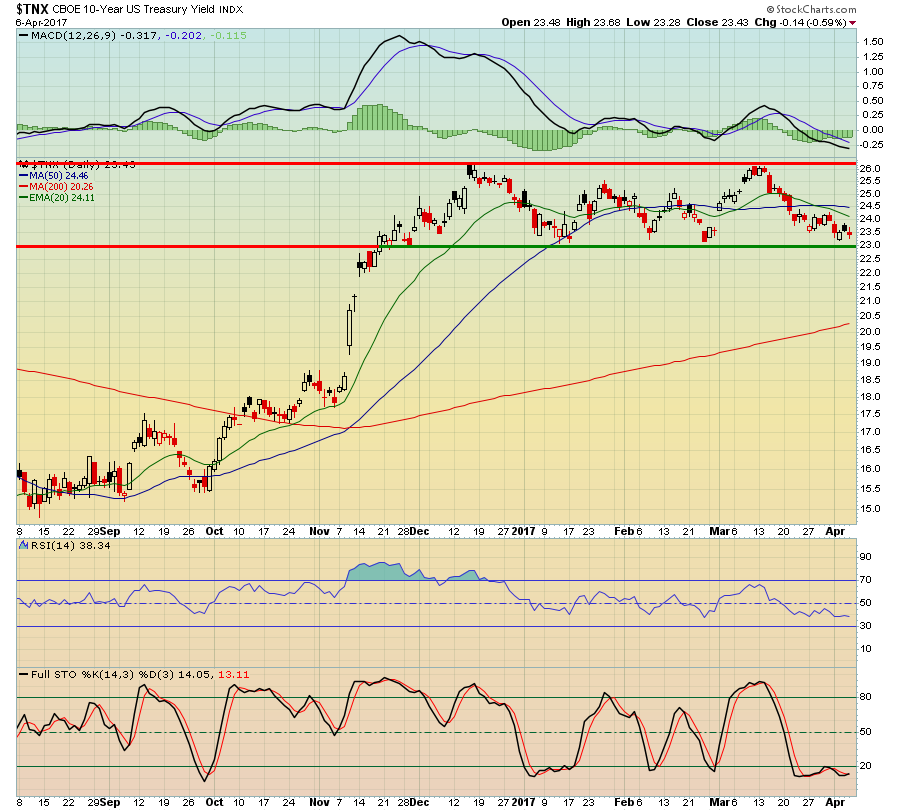
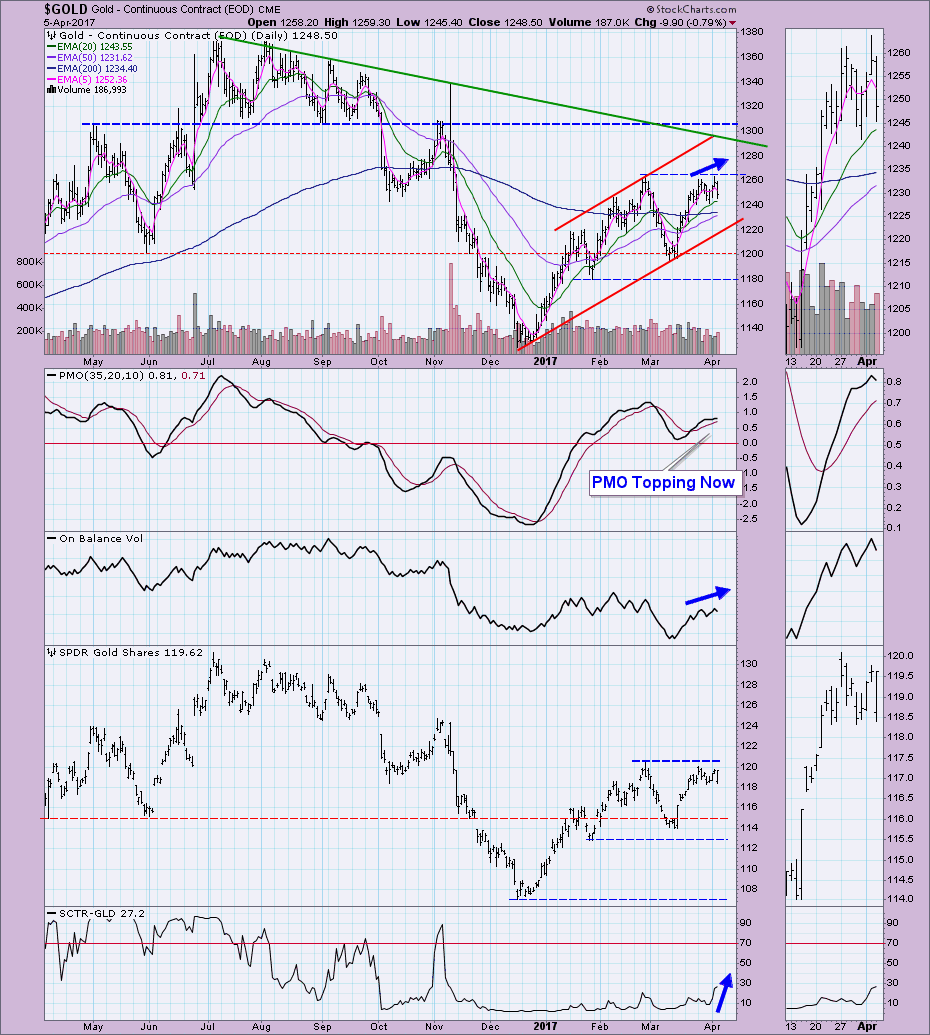
Agree or Disagree: In this weekly segment, Tom and Erin look at a few charts and then see if they agree or disagree on the outlook. Today Tom and Erin looked at 10-year Treasury Yields and Gold. Both of them were bullish on yields, but disagreed on Gold with Erin bullish and Tom bearish.
 Erin seems to have made the best case for being bullish on Gold...at least 2/3 of you agreed with her bullish position during the live poll.
Erin: "I'm bullish on Gold right now based on the positive PMO and OBV action. Although Gold was stopped at resistance today, I expect another stab at it soon with a move to around 1290 or so.
Gold, although showing a PMO top after today's close, still has promise. There is a nice bullish confirmation on the OBV and the SCTR is showing improvement after months of doldrums."
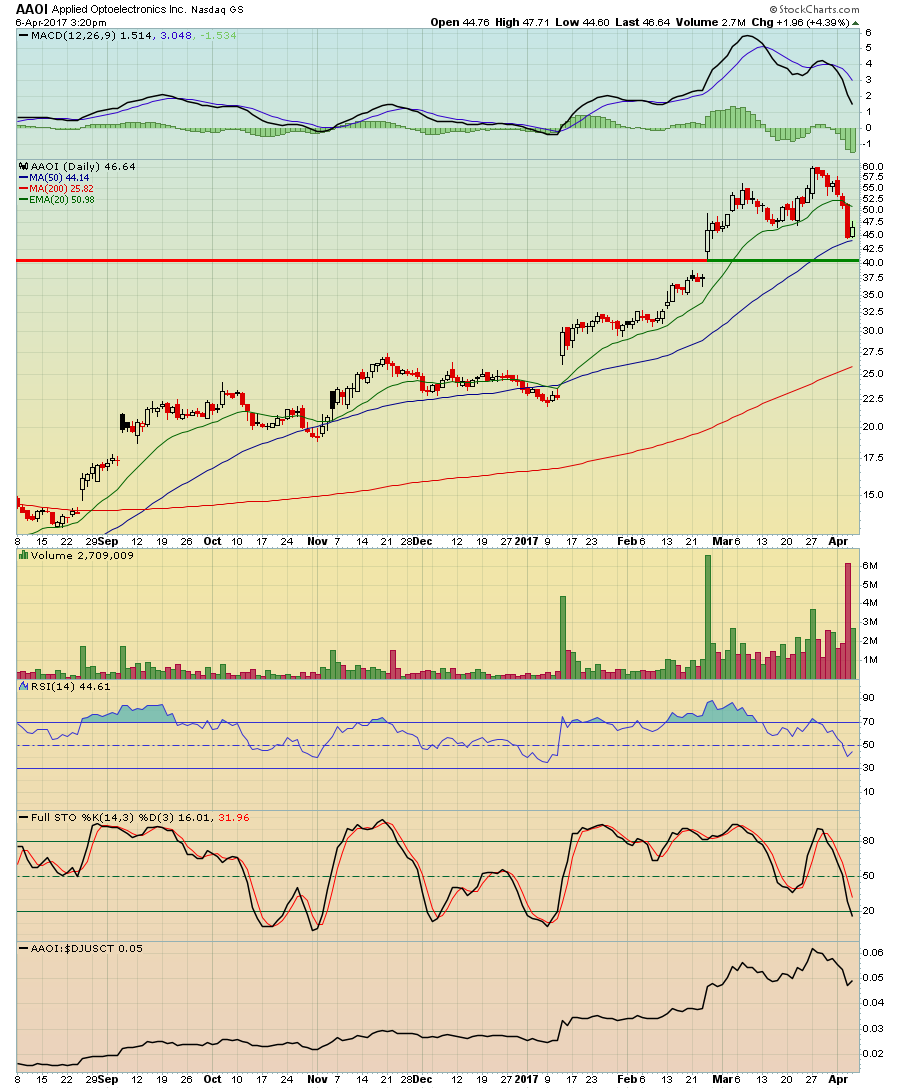
Ten in Ten: In this weekly segment, Tom reviews ten chart set-ups in ten minutes! This is a quick paced look at what is hot and what is not. One of the charts covered was AAOI below.
Indicator of the Week: Tom looked at the MACD indicator and explained how it is calculated. He explained how he uses it to screen for trades. You'll find complete information on the MACD in ChartSchool at this link. Tune in to learn more about Tom's use of the MACD.
It's a wrap! In closing Tom wants to remind you that he will be doing a "StockCharts Outlook" recorded webinar on Sunday, April 9th at 11:00a EST with Greg Schnell. For more information and how to register, click here.
Don't miss this Friday's show 9:00a - 1:30p EST! Tom and Erin will be introducing new segments and asking you to participate via Twitter and Facebook.
