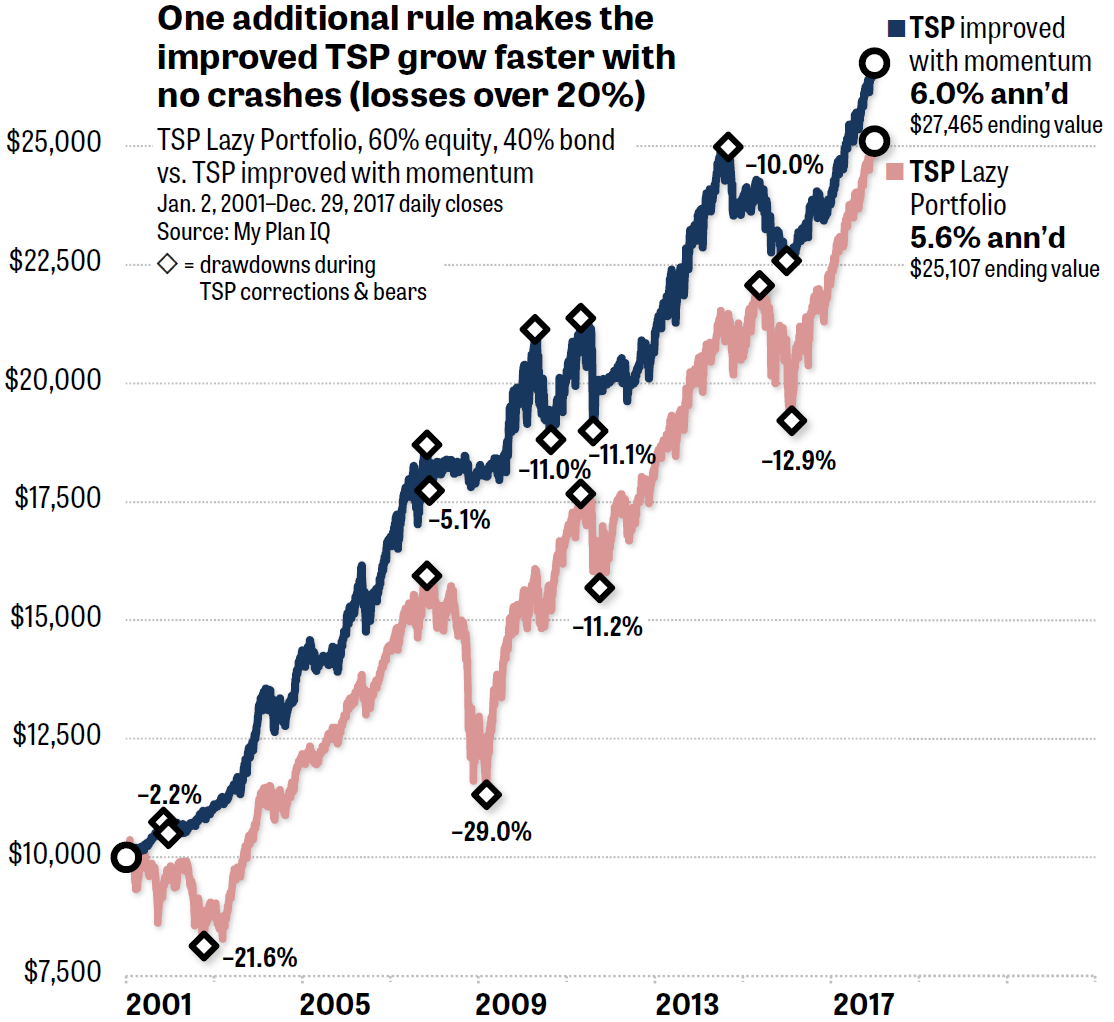
An easy-to-follow variation — independently tracked in real time, not a backtest — boosts TSP’s gain while reducing its losses. The method eliminates any drawdowns worse than about 11%. By comparison, a buy-and-hold of the same assets fell 29%, which would compel many individual investors to liquidate.
Part 1 of this column appeared on Nov. 20, 2018.
As we’ve seen previously, the Federal Thrift Savings Plan presents severe limitations for serious investors. Although the plan boasts ultralow fees, which is good, it includes no more than five major asset classes: just three kinds of equities and two kinds of US bonds. The program also prohibits its 5 million account owners — by far the largest number of members in any 401(k)-type plan in America — from making changes in their positions more than twice a month.
Despite these restrictions, one website — My Plan IQ — shows a simple fix. The site tracks in real time the performance of thousands of corporate 401(k) plans and demonstrates how to improve them. All TSP account holders can thereby increase their gains and reduce their losses. The resulting portfolios get a bigger return while keeping drawdowns well below the “throw in the towel” level that harms long-term traders’ results.
The image above shows the difference between a buy-and-hold (B&H) of TSP’s mutual funds and My Plan IQ’s alternative. The formula — which is totally mechanical and requires no computations on the investors’ part — would have given a 15-year participant who started with $10,000 an ending balance of $27,465. An inattentive TSP owner using B&H would have ended up with only $25,107 — $2,358 less.
That may not seem like much. But remember that most TSP participants hold far more than $10,000 in their accounts. The above graph includes only the gains on an initial $10,000. It doesn’t include any contributions over the years that most federal workers make.
The US government automatically deposits 1% of the salary of federal employees, even if the participant contributes nothing. On top of the first 1% “match,” contributions that workers make, up to 3% of salary, benefit from a 100% match. Additional contributions, up to 5%, get a 50% match. That’s one of the more generous 401(k)-style plans.
Computing bigger gains and smaller losses for TSP
I produced the above graph in Excel using a history of daily closes provided by My Plan IQ. Unlike the graphs shown in my columns on Morningstar’s Bucket Portfolio or my Muscular Portfolios summary, the data points were not produced using a backtester. Instead, My Plan IQ calculates the return on corporate 401(k) plans and its own asset-rotation formula every day after the market closes. This permits no hindsight. The site’s servers started tracking the above two portfolios, and many others, on Jan. 2, 2001, which is where my graph begins.
Unfortunately, the free sections of My Plan IQ’s website only contain graphs to show visitors the last 10 years of real-time tracking. That’s why I’m showing you the full record here. Those who support the site with a paid subscription can download the entire history of monthly or daily closes, as I did. (I’ve been a subscriber since June 2013.)
Because TSP offers only two major asset classes — equities and bonds — it’s impossible for anyone to construct the ideal mechanical-investing strategy using the plan alone. In the 17 years shown in the above graph, $10,000 would have turned into $27,465 in a TSP asset-rotation strategy, which is an improvement over a buy-and-hold. But the starting value would have turned into $28,724 in a buy-and-hold of SPY, and $76,539 in an unrestricted Muscular Portfolios strategy, such as the Papa Bear. (All ending values include dividends and subtract ETF fees.)
The limitation on expected returns is because an investor in TSP can’t move into index funds representing real estate, commodities, precious metals, and non-US bonds — choices that are available in a Muscular Portfolio. More importantly, most individual investors can’t or shouldn’t tolerate the losses of 30%, 40%, and 50% that SPY — mirroring the S&P 500 — subjects its victims to every 10 years, on average.
But just because TSP is not perfect, that’s no reason for federal workers to avoid it and miss out on the generous match. My Plan IQ’s formula makes even TSP’s limited selection of assets attractive by keeping losses exceptionally small.
As we can see in the above graph, a buy-and-hold of the TSP funds would have stopped the hearts of account holders during the 2007–2009 financial crisis with a 29% loss. That’s beyond the 20% or 25% “behavioral pain point,” according to financial researchers, that causes individual investors to start liquidating.
A subset of the same TSP funds, selected once a month based on each fund’s price momentum, experienced a maximum drawdown of only 5.1% during the same period.
Another advantage of the formula is keeping the length of losses short. A buy-and-hold adherent would have agonized over that 29% loss for 16 lo-o-ong months as the static portfolio ground down, down, down. Many people would find that pain intolerable and cash out. By contrast, the mechanical formula subjected its users to their mere 5.1% drawdown — not even a mild correction — for only 16 trading days in November 2007. After that one down month, My Plan IQ’s gradual asset rotation policy kept the portfolio roughly level, as shown in the above graph, while global equity markets crashed. (All drawdown figures in this column are measured between daily closes.)
The situation was even better in the 2001–2002 bear market. Buy-and-hold TSP followers lost 21.6%, but the mechanical formula’s worst drawdown was a tiny 2.2%. Again, that very minor disappointment troubled mechanical investors for only 27 trading days (Nov. 8 to Dec. 17, 2001). At the end of the bear market, the momentum portfolio was actually slightly up in 2002!
In the remainder of this series, we’ll see the exact formula — which is fully disclosed, to My Plan IQ’s credit — and how you can use StockCharts.com to find the strongest index funds in just this way in any type of account.
Parts 3 and 4 of this column appear on Nov. 27 and 29, 2018.
With great knowledge comes great responsibility.
—Brian Livingston
CEO, Muscular Portfolios
Send story ideas to MaxGaines “at” BrianLivingston.com