Below is the weekly Relative Rotation Graph holding the constituents of the Dow Jones Industrials index. My starting point to have a look at the relative positioning and movements of its components.
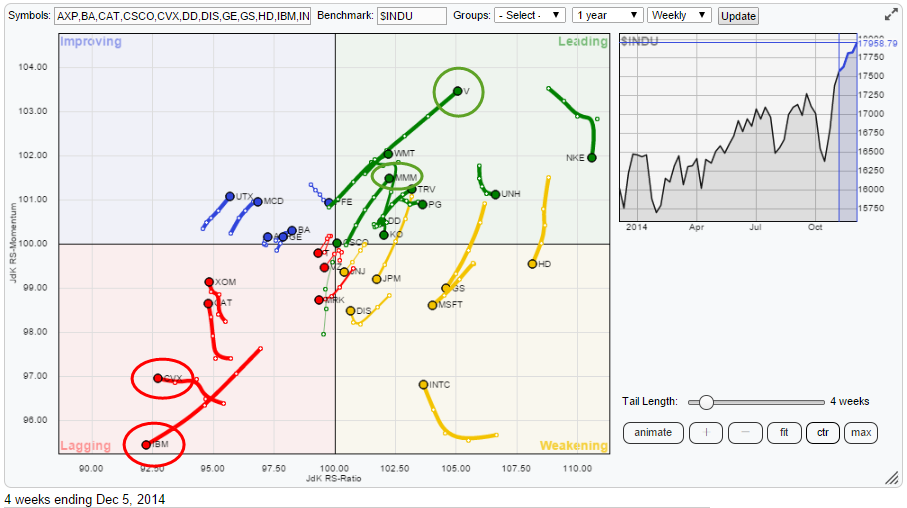
Many observations can be made off of this chart but I have circled a few that I want to take a look at in this post.
In the lagging quadrant (lower left) these are IBM and CVX. This is the area on the RRG chart where we find the stocks that are in a relative down-trend (JdK RS-Ratio < 100) against $INDU and that down-trend is still being pushed further down by negative relative momentum (JdK RS-Momentum < 100). In the top right quadrant, the leading quadrant, they are V and MMM. This is the area where we will find stocks that are in a relative up-trend against $INDU and this up-trend is still being pushed higher by strong relative momentum.
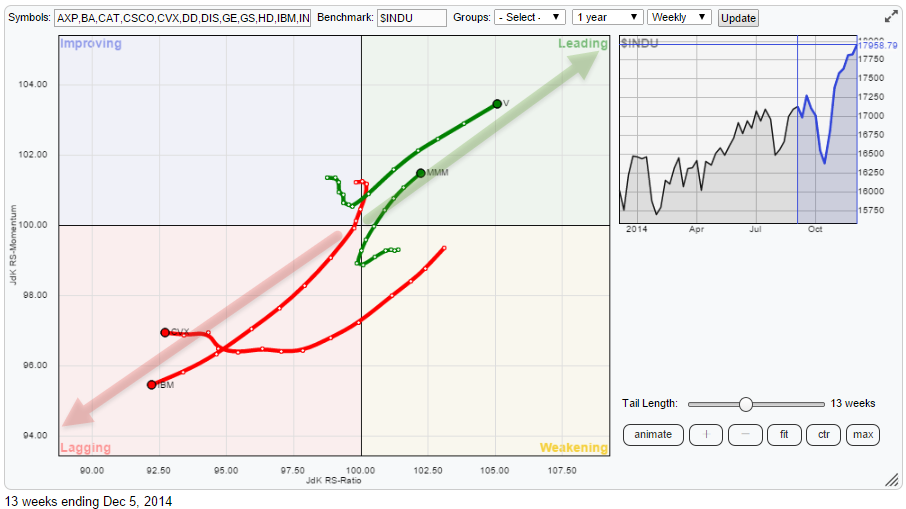
In order to enable a bit more focus on these stocks I have created version of the RRG only holding these four names. As we now have a less crowded plot we can lengthen the trail a bit to get a better handle on historical rotation. This can easily be achieved on the StockCharts.com platform by ticking off the boxes in front of the names you do not want to show (in the table below the RRG chart) and sliding the tail-length slider to the right until you find a balance that makes a readable chart. This one holds 13 weeks, one quarter, of data.
International Business Machines
My previous view on this universe dates from about a month ago and can be found in this post. In that post IBM already popped up as a potential under-performer. The updated price chart in combination with the RRG-Lines is shown below.
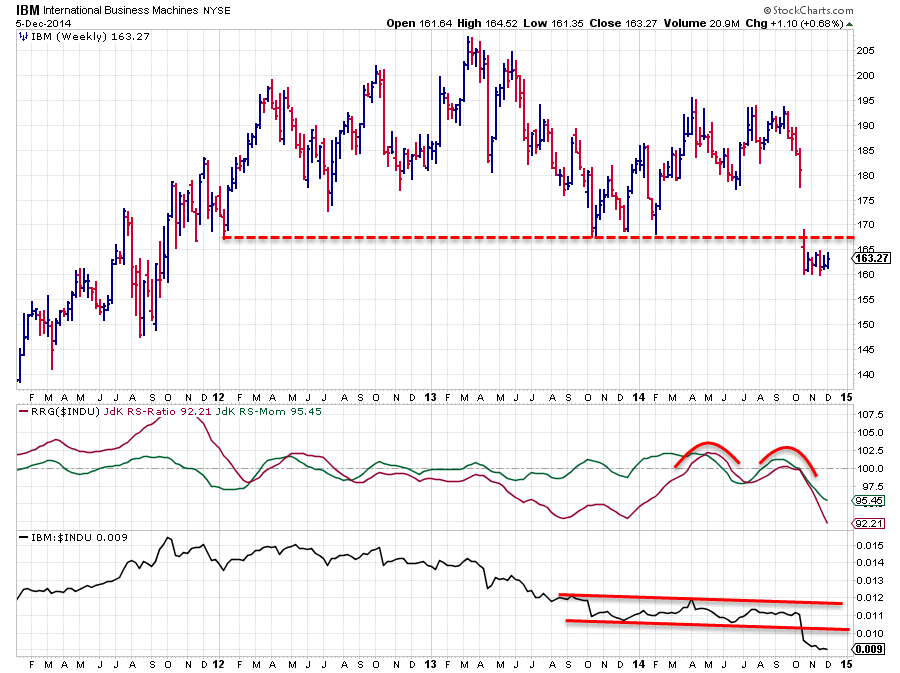
Despite the sideways movement on the price-chart the continuing relative weakness is clearly visible from the further drop of the raw-RS line (lower pane) which results in a steep dive of the JdK RS-Ratio line to very low levels. The still falling JdK RS-Momentum line indicates that the relative down-trend is still in full force and that no improvement seems to be in sight for coming weeks.
On top of that the previous horizontal support level just above 165 on the price chart will start to act as resistance going forward and very likely cap any upward movement for the time being.
Chevron Corp.
The other stock showing up in the lagging quadrant is Chevron (CVX). It catches attention as it is deep inside the lagging quadrant and still heading lower on the JdK RS-Ratio axis. The almost horizontal move (hardly any change on the JdK RS-Momentum axis) indicates that it is a very stable relative down-trend.
On the price chart in combination with the RRG-LInes this translates into the following.
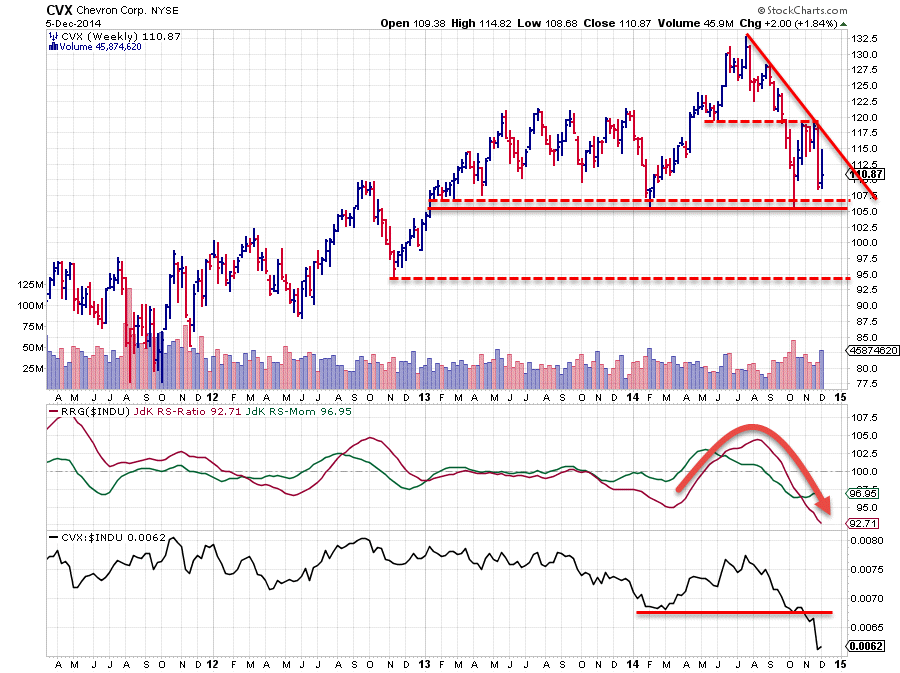
If we start with the raw-RS line we can see that the break below the previous low triggered an acceleration in under-performance. This is pulling the JdK RS-Ratio strongly lower bringing it deep inside the lagging quadrant. This whole setup suggests that further weakness lies ahead for CVX.
On the price chart we see that a clear pattern of lower highs followed by lower lows is intact. The recent rally respected the resistance coming off a former low which acted as support previously and a new important lower high was set. The horizontal support area between 105-107.50 is now the most important area to watch. A break below this level in combination with the current very weak relative conditions will very likely result in an acceleration of the down-trend on the price chart as well. The only serious support level for CVX after that is only found near 95.
It looks like CVX is lacking both absolute and relative fuel!
Now on to the more positive side of the RRG chart where I picked Visa Inc. (V) and 3M Co. (MMM).
3M Co.
If at any time you run into a discussion with someone who tries to convince you that movement of stock-prices is "random" show them the current 3M chart chart and I think the discussion will be short-lived... And yes I am aware of the fact that "in general" and "over a long-term period" stock price movements are "random". But I also know that "in general" is not equal to "always" and also that "long term" spans multiple cycles i.e. > 4-5 years. And I am very happy to trade "short-term" moves that last a year or longer ...
Now, with that in the back of your mind, have a look at this chart.
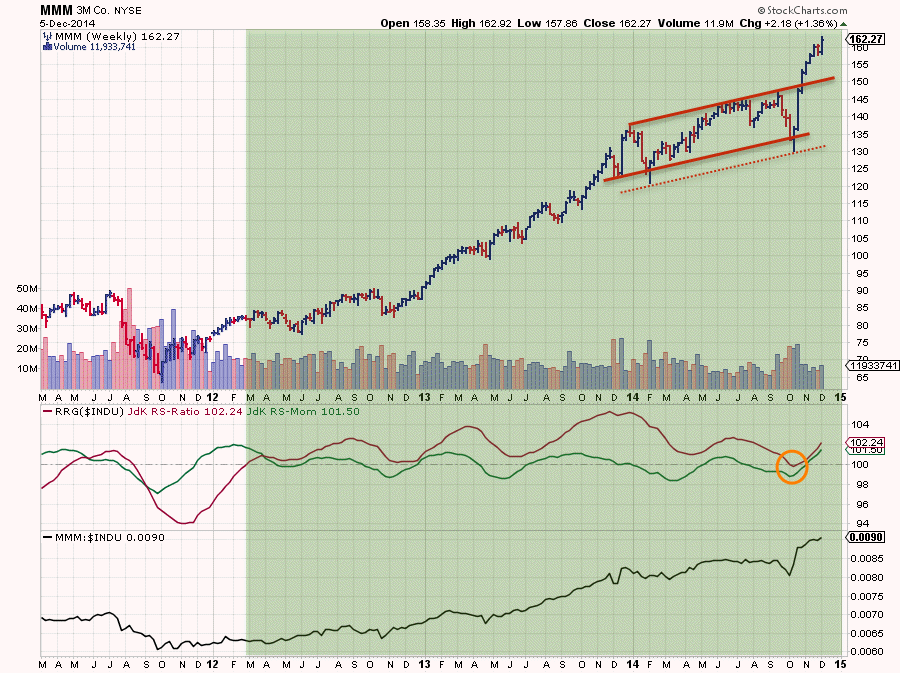
Out of the reversal pattern at the end of 2011 a very nice up-trend emerged which is still working its way higher. 2014 looked like a slow-down as the pace of the trend fell slightly but we seem to be ending the year with a bang after the upward break above the already rising resistance line that has been marking the upper boundary of the 2014 trend.
From a relative point of view the up-trend started in the beginning of 2012 and it is still holding up. During the (relative) up-move we have seen some periods with a loss of momentum (JdK RS-Momentum dropping below 100) and two moments where the out-performance seemed to come to a halt (late 2012 and very recently in October of this year). On both occasions the red JdK RS-Ratio line carved out a bottom just above or on the 100-level. After the recent loss of relative momentum 3M is more than back in the game with a very strong price chart that is breaking to new highs and a relative strength that is just getting new fuel, the fuel that CVX is lacking, to push higher!!
Visa Inc.
The second stock in the leading quadrant is V. This chart is in the same league as 3M above, with some minor differences.
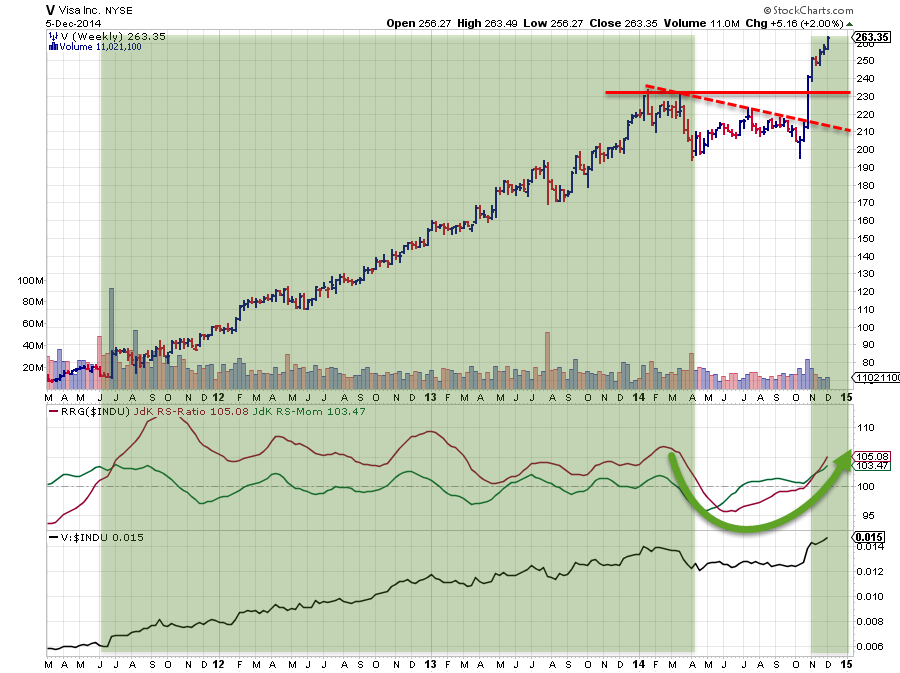
Both the up-trend on the price chart and on the relative chart for V started a few months earlier, somewhere mid 2011. And where 3M managed to fend off a drop in relative strength this year, V went through a period of under-performance for the better part of 2014. On the price chart the sideways movement is clearly visible. The improvement over the past few months is now getting its follow through.The strong up-move at the turn of the month broke a few important resistance levels with ease, displaying a lot of strength. And the follow-through has been strong without any pull-back (yet). This makes Visa one of the strongest stocks in the universe at the moment.
Conclusion
- IBM still in a very strong (relative) down-trend, very limited upward potential
- CVX showing very weak relative strength, watch a break below support near 105 for an acceleration of down-trend in price
- MMM firing on all cylinders with a topped up tank of gas
- V picking up positive momentum again on both the price and the relative charts
Julius de Kempenaer | RRG Research
