The Relative Rotation Graph below holds a number of ETFs that represent various asset classes while using VBINX (Vanguard Balanced Index Fund) as the benchmark.
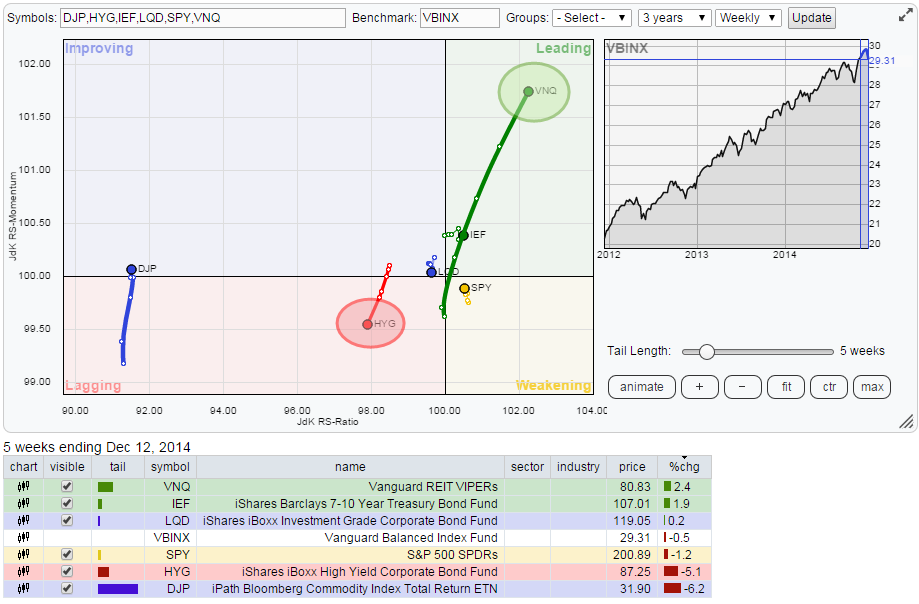
For sure that long fat green tail on VNQ catches my attention...
In my last blog on asset class rotation I mentioned in the conclusions that VNQ was a tricky one to analyse and that a 'decisive' move either way was needed to get a clearer picture. I guess this is one of these occasions where "you better be careful what you wish for because you may get it..."
Because a decisive move we got, let there be no doubt about that.
The other observations I want to touch on in this article are the negative heading on HYG (High Yield), the still very weak picture for DJP (Commodities) and the Equity Bond rotation which is now very close to turning in favour of Bonds for the first time in a very long period.
Vanguard REIT VIPERS
On the weekly RRG above VNQs are shooting for the stars. It is now the asset class with the highest JdK RS-Ratio value as well as the highest JdK RS-Momentum value and it is rising on both axes. It won't get much better than this.
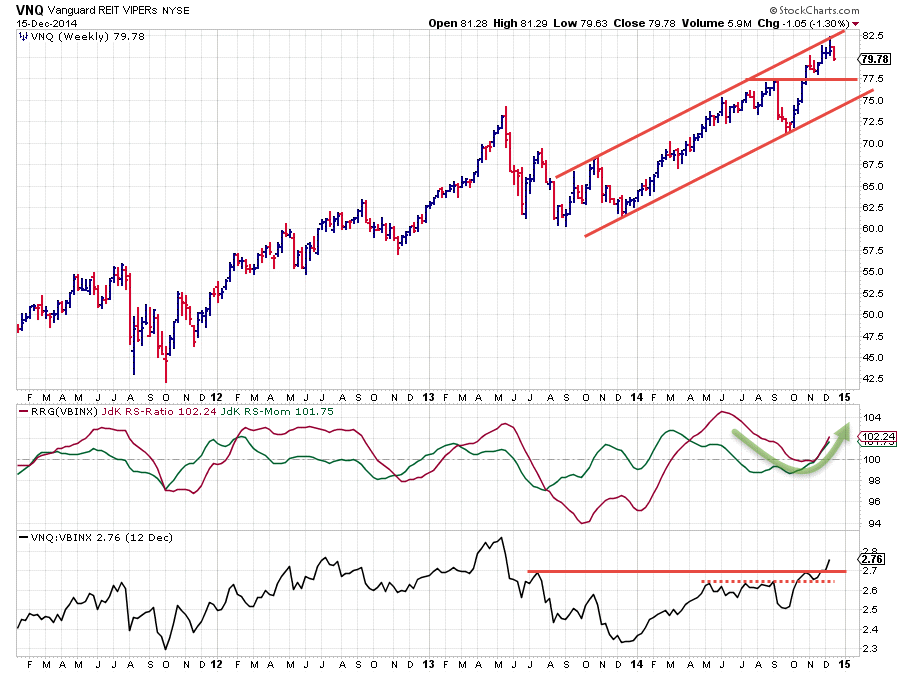
From a relative point of view that is of course as also real estate, represented by VNQ, dropped in price over the past week or so. But they dropped less fast than VBINX resulting in this strong relative strength.
The raw RS line (lower pane) is still working its way higher in a series of higher highs and higher lows which results in a JdK RS-Ratio above the 100-level, indicating an out-performance. This upward trend in relative performance lost strength / momentum since June and almost turned down but recent price action caused the relative trend to pick up strength again and pull the JdK RS-Ratio away from the 100-mark indicating that a new leg up has started and is now underway.
On the price chart the up-trend is still fully intact. There is a nice trend-channel visible that started in Q4-2013 and which is still fully intact. This upward trend in price was recently confirmed when the horizontal resistance level at 77.50 was taken out to the upside. The subsequent rally tested the upper boundary of the rising channel and price is now correcting off of that barrier. The previous resistance at 77.50 should now start to act as support and catch any declines, potentially offering new buying opportunities at these lower levels.
This is the strongest sector within this universe of asset classes at the moment.
iPath Bloomberg Commodity Index Total Return
Without a doubt the weakest asset class on the plot is commodities, represented by DJP.
The (raw) Relative Strength of this ETF versus VBINX is in a falling trend for more than three years now with the exception of two short quarters (roughly) in late 2012 and earlier in this year (2014) when the JdK RS-Ratio briefly peeked above the 100-level but was not able to sustain that strength.
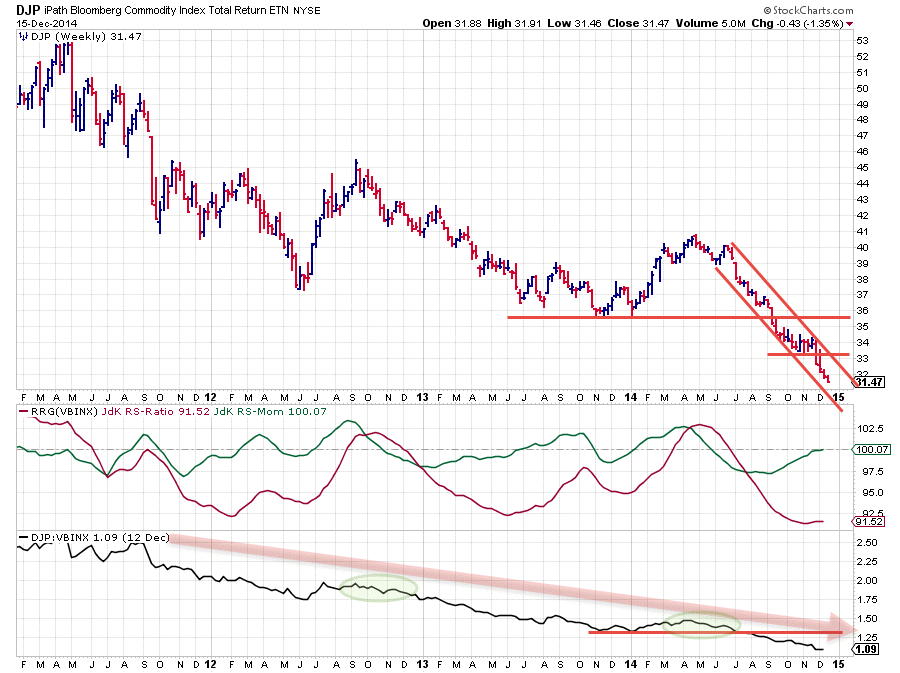
From a relative perspective there is nothing good about this asset class. It is all down and there is no sign of improvement in sight. The break below horizontal support in the raw RS-line in July triggered another leg down and this was picked up by the JdK RS-Ratio line which is now moving at very low levels. This indicates a strong and mature down-trend in relative strength.
At such low levels the recent rise of relative momentum (green JdK RS-Momentum line) can only be interpreted as a temporary hiccup within the longer term falling trend and a new leg down is therefore likely.
This is more or less confirmed by the continuing weakness on the price chart where we see a very steep falling channel in play since June of this year. In September this down-trend was confirmed by a break below the horizontal support level coming of the 2013 lows. The acceleration that followed after this break stalled just above 33 in October/November but recently this newly created support level was also violated and a new acceleration down is now under way. Do not be surprised when the green RS-Momentum line will start to form a new high against 100 and start pushing the RS-Ratio line further down again in coming weeks causing a new rotation back into lagging quadrant again.
Zooming in on the RRG
With the two outliers now out of the way we can zoom in on the remaining asset classes son the RRG. This is easily achieved by ticking off DJP and VNQ in the table below the RRG and clicking 'update'. This results in the picture below.
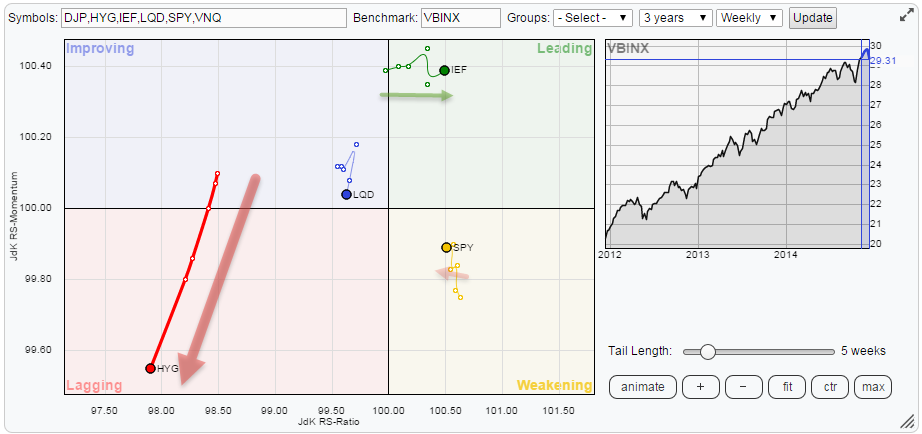
The two things on this picture I would like to talk about are the the strong downward move of HYG and the, albeit very early yet, opposite move of IEF and SPY.
iShares iBoxx High Yield Corporate Bond Fund
High yield bonds are taking a nose-dive. Their relative strength versus VBINX is already weak for about two years now. Early 2013 the JdK RS-Ratio dropped below the 100-level signalling a down-trend in relative strength. It has been moving below that 100-level ever since. The attempt to turn the situation around in June of this year failed at the 100-line and, as is often the case, failures lead to a strong move in the opposite direction. The break of horizontal support in the raw RS-line triggered an acceleration down which is still well under way.
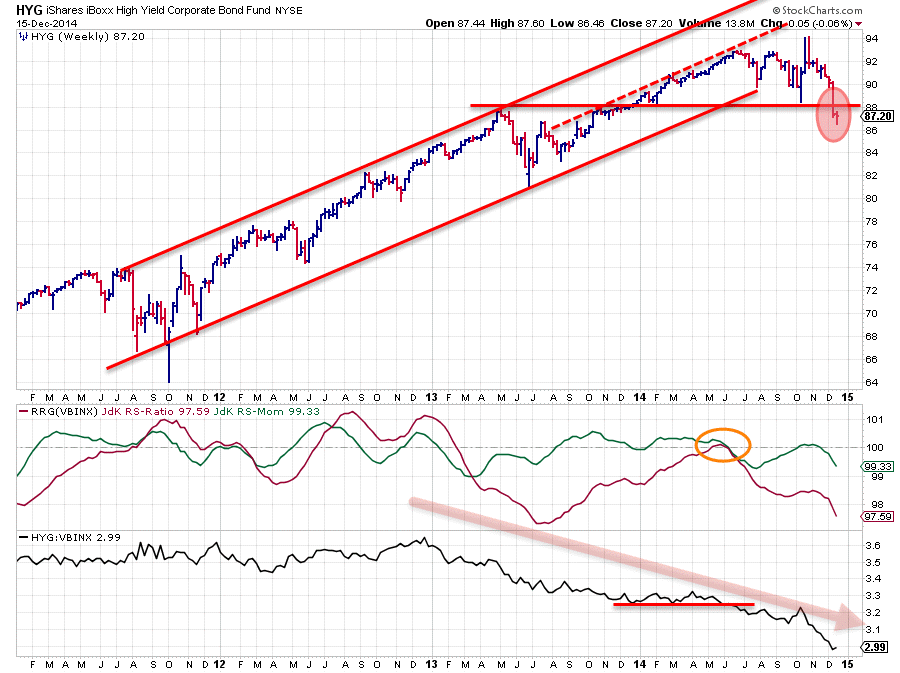
The recent hiccup in relative momentum and subsequent turn down again are causing a rotation on the left hand side of the Relative Rotation Graph, the characteristic for a strong downward move. Just a week or so ago HYG also broke an important horizontal support level on the price chart. As you can see on the chart above this 88 area was a pretty significant level which played an important role over the past two years. Expect this break to trigger a downward acceleration in price. First serious support level only to be found in the 80-82 area.
Equity - Bond rotation
On the RRG-chart both equities (SPY) and bonds (IEF) are on the right hand side of the plot which means that they are both still in a relative up-trend against VBINX. But... things are happening.
First of all IEF is in the leading quadrant while SPY is in the weakening quadrant. This means that IEF is adding to its relative strength (moving from left to right) while SPY is losing RS (moving from right to left). The lack of relative momentum on both securities indicates that it is a very gradual move. This is best seen on the picture below.
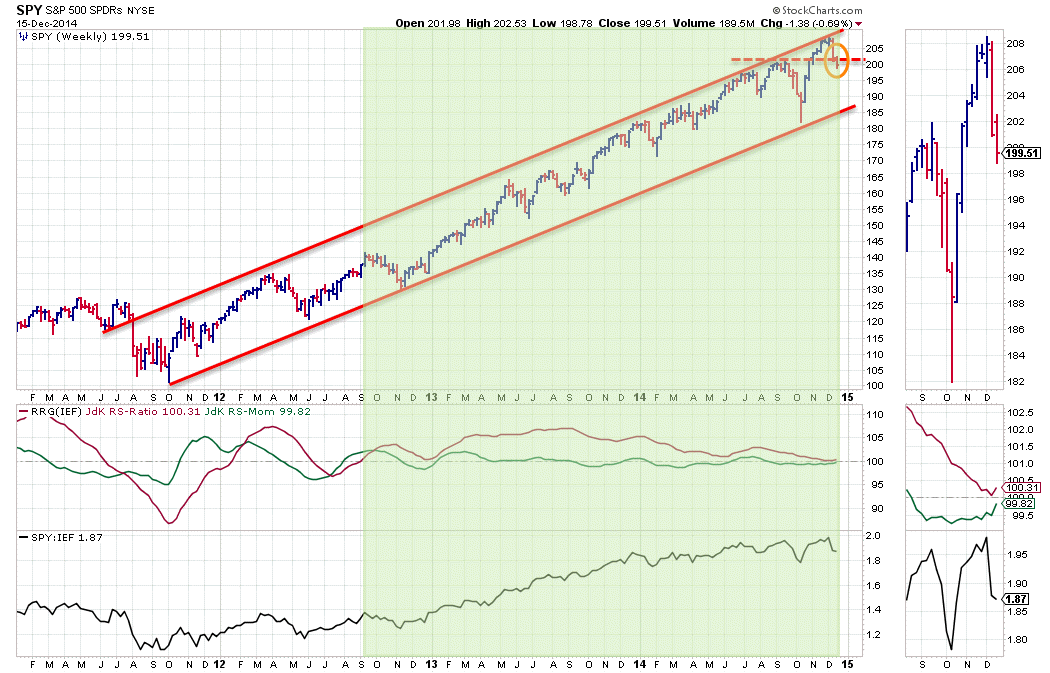
The very steady up-trend is clearly visible on the raw RS-line, resulting in the JdK RS-Ratio moving above the 100-level since Q3-2012. Since the beginning of this year the RS-Ratio line has very slowly lost pace and headed back towards the 100-mark. This is not negative in itself it is just indicating that the relative up-trend is still intact but getting less strong.
At this moment both RRG-lines are very close to the 100-line so here the zoom-thumbnail function comes in very handy to zoom in on what is going on. What we see is that over the past few weeks the RS-Momentum line pulled up slightly again, causing the RS-Ratio line to bounce off the 100-line while keeping the up-trend of Equities over Bonds intact.
The lack of relative momentum on both sides makes a clear call difficult at this moment, I would like to see a little bit more evidence but given the fact that IEF is in the leading quadrant and moving higher on the RS-Ratio axis while SPY is in the weakening quadrant and moving lower on the RS-Ratio axis I am inclined to say that Bonds are rotating into favour over equities.
Conclusion
- Real Estate / VNQ is shooting up and became strongest asset class
- Commodities / DJP continuing relative (and absolute) down-trend without any signs for improvement
- High Yield bonds / HYG breaking to new lows on price and relative charts giving way to acceleration down
- Bonds / IEF on the verge of rotating in favour over Equities / SPY
Julius de Kempenaer | RRG research
RRG, Relative Rotation Graphs, JdK RS-Ratio and JdK RS-Momentum are registered TradeMarks by RRG research.
