Last week I received a question from a StockCharts.com user on RRG charts via e-mail. Usually, I try to answer such questions in 1-1 fashion by replying to the particular email. Most of the time this involves pointing to information on Relative Rotation Graphs that is already present in some ChartSchool articles.
However the question at hand could be something that more people might wonder about, and although I think it could be answered by just pointing to some chartschool articles, it may need some extra clarification.
A Question?
This is the question that popped up in my mailbox the other day:
Hi, I have been studying your RRG charts in stockcharts.com site. I have a quick question. If I am observing a weekly view, what does a stock with an RS-momentum value of 105 equate to in respect to time? So, if a stock has this 105 value it is outperforming the $SPX. But on what time frame, the past 6 months, past year? Also, if 2 stocks have the same RS-momentum value are they both outperforming the $SPX by the same percentage on a raw RS basis.
This problem goes back to the basis of Relative Rotation Graphs and has everything to do with the way I approach relative strength as a concept.
Different approaches to the Relative Strength concept
As you can see the user, like many others, especially in the US, wants to connect "a" relative strength value to "a" period like a number of months or a year. I know this is a common way to show relative strength or market leadership, but my problem with that approach is that it does not "really" try to identify or pick up any "trends" in this relative performance especially when the periods are relatively long like 6-months or a year. I have attempted to clarify that in the perf-chart below.
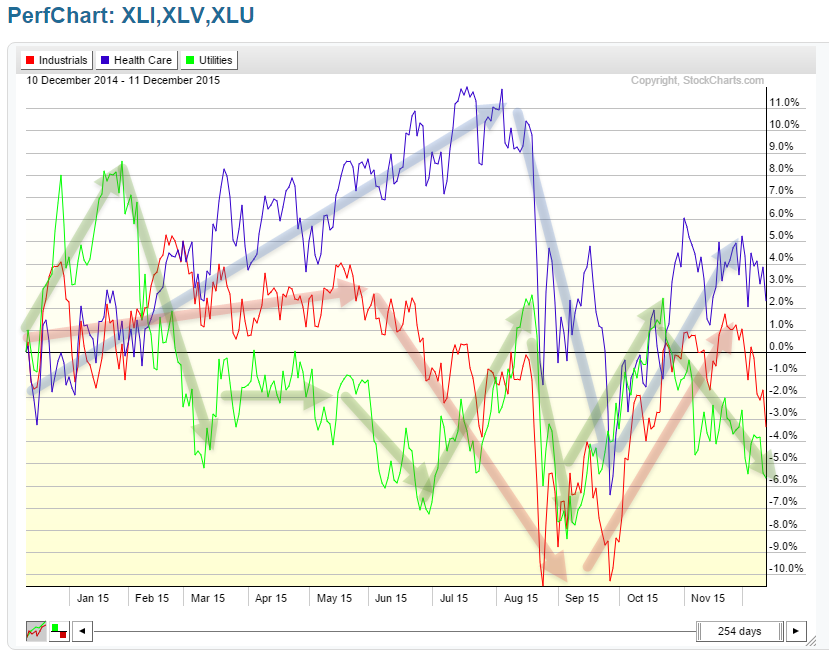
This perf chart shows the performance of three sectors against the S&P 500index over exactly one year as you can see the number tell only part of the story. They will tell you that Health Care outperformed the S&P 500 roughly 2-3% over the past year and that Industrials and Utilities underperformed by approximately 3% and 6% over the same period. However when you look at the various paths that led to the end-point of each line you can see that these are quite different.
Health Care, for example, is showing a great move until July-August, by that time the sector was 11% ahead of the S&P 500. From the peak in relative performance until the trough in September that same Health Care sector is showing a 17% underperformance. Something similar happens in Industrials. Until May, the sector is a stable outperformer over the S&P 500. From May to August however Industrials trails the broader market performance by 14%. These are quite big moves, not only percentage-wise, but they also span a decent period of time.
Just like we try to identify trends in regular stock prices we can try to determine trends in relative strength. Using the "performance-over-time" approach to identify relative strength will provide you with some challenges as the numbers and the positions of the highs and lows of the various lines will constantly change. This is because they are anchored to a fixed point in history, i.e. one year ago or six months ago. Every time the anchor changes (every day when used on a daily time frame) the subsequent numbers of relative strength and the positions of relative peaks and troughs will change which makes it difficult, if not impossible, to "identify" trends in these lines.
For this reason, I started to use what I call "raw Relative Strength" which is simply the price of a security divided by the price of another security. If we look at sectors, it would be { Close of sector / Close of $SPX } the good thing about this number is that it is a fixed number and that it will not change anymore over time. When plotted over time in combination with stock price development this raw RS-Line will show you the performance of the sector relative to the performance of the benchmark ($SPX), and we can use any type of (technical) analysis in order to identify trends in this raw RS-Line.
This works fine in any one-on-one comparison like analyzing Health Care versus the S&P 500 or looking at Industrials against the S&P 500. But when you also would like to know how Health Care compares to Industrials then these individual numbers against the S&P 500 cannot be used as they are incomparable. They are like apples and oranges. Let alone when you want to compare a whole universe like all ten GICS level 1 sectors against the S&P 500 and against each other.
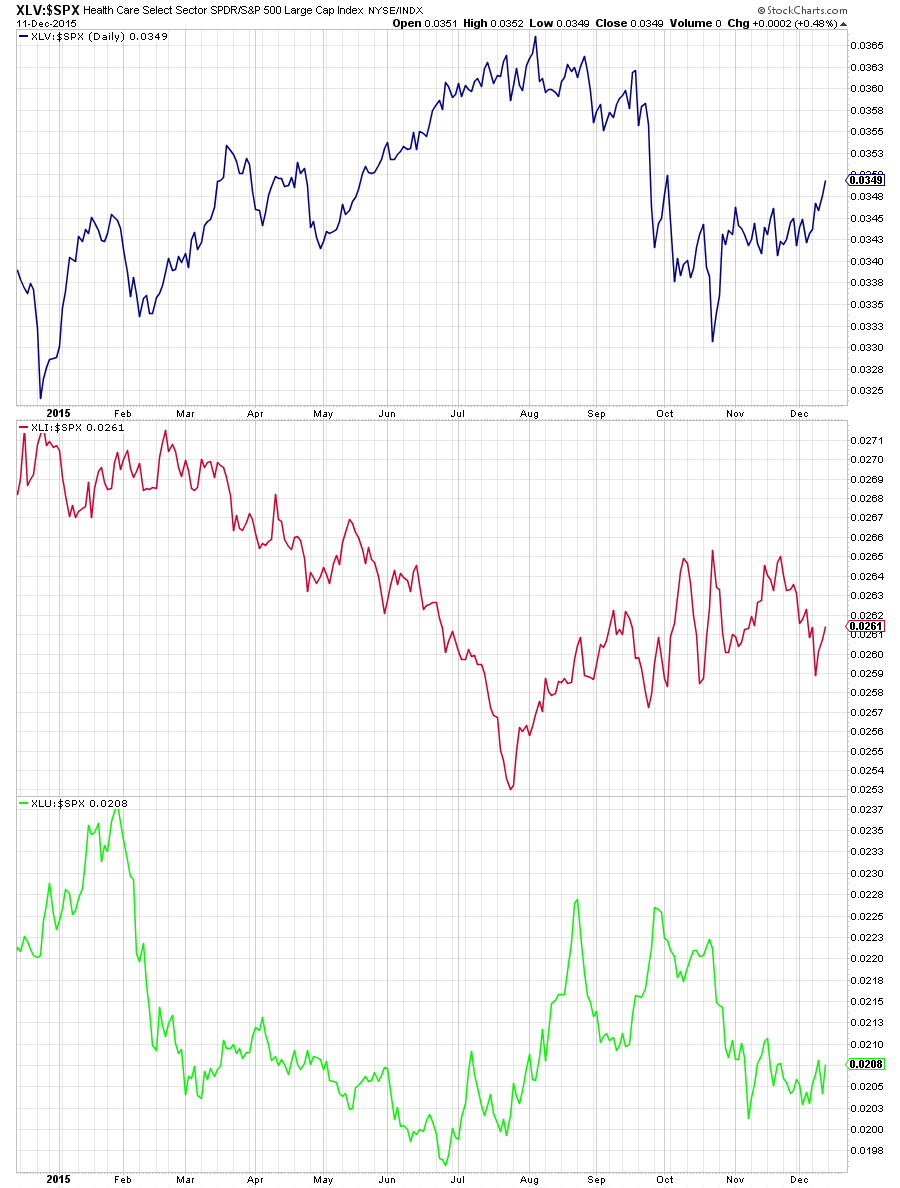
The chart below shows these "raw RS-Lines" against the S&P 500 index for the same three sector indices as in the perf chart above over the exact same period. Note the differences!
So in order to relate all this back to the original question, or at least, the first part of it;
If I am observing a weekly view, what does a stock with an RS-momentum value of 105 equate to in respect to time?
The answer to this would be "Nothing" as the values of the JdK RS-Ratio, and the JdK RS-Momentum lines are not pegged to the performance of a security over a given period of time.
Then after this first part of the question comes an assessment:
So, if a stock has this 105 value it is outperforming the $SPX. But on what time frame, the past 6 months, past year?
Relative performance vs. "trends" in Relative Strength
The second part of this evaluation has already been clarified but the first part needs our attention as it is not (entirely) correct. This statement assumes that RRG and the RRG indicators measure "performance" which is only true to some extent. RRG and more specifically the JdK RS-Ratio line try to identify and quantify TRENDS in relative strength and this is something fundamentally different from measuring performance as such.
When we look at a chart, any chart, and we see it moving higher (or lower) in an orderly fashion we like to call that a "trend" the basic definition I always use for a (n up-) trend is "a series of higher highs and higher lows". Does this mean that every day or every week the price of that security is higher than the previous day or week? Most definitely not. In general, the price is moving higher but there will be intermittent periods where prices will decline. A trend is not a straight line. It is the same with trends in relative strength. Look at the chart holding the three raw RS-Lines, the general trends over various periods can easily be spotted but as you can see they are not straight lines. This means that even if the "relative trend" moves in one direction it is very well possible, even unavoidable, that we will see counter-moves from time to time.
The question only mentions, RS-Momentum which needs to be addressed as the JdK RS-Ratio line is the indicator that measures / identifies the relative trend. A JdK RS-Ratio value over 100 signals an uptrend in the relative strength line while a JdK RS-Ratio value below 100 suggests a downtrend in relative strength. The higher, or the lower, this RS-Ratio value, the stronger and/or more mature this relative trend is. If I have to connect the measure of trend, to a time period I usually use a rule of thumb of three months on a weekly time frame. When the JdK RS-Ratio crosses above 100, i.e. changes direction t is estimated that the new trend will be in place for a minimum of three months. My experience is that very often it will be much more than three months while sometimes it will be shorter, but the skew is definitely towards periods > three months. Translate that to a daily time frame and you will be looking at roughly three weeks for trends on a daily chart.
The JdK RS-Momentum value does not measure momentum of price, not even momentum of the raw RS-Line, at least not directly. The JdK RS-Momentum line measures the rate of change (pace and speed) of the JdK RS-Ratio line and can, therefore, be used as a gauge, or an early warning system, of potential upcoming changes in relative trend.
Relating back to the assessment above, a value of 105 (or any other value for that matter) does not relate to any performance over a period of time but is an indication of the strength of current relative trend against the chosen benchmark.
This leaves the last part of the question:
Also, if 2 stocks have the same RS-momentum value are they both outperforming the $SPX by the same percentage on a raw RS basis.
I could make it easy for myself by simply answering "NO" but let me try to elaborate a bit more and make it clear.
By now I assume you will have picked up that RRG and the RRG-Lines, the indicators that serve as the inputs for the actual Relative Rotation Graph, measure trends in relative strength and the strength of those trends and, therefore, cannot be tied directly to (relative) performance as such. The benefit of the algorithms that feed the RRG-Lines is that they are normalized which makes them comparable across the universe on which they are applied. This is crucial when it comes to the visualization which is ultimately the goal of a Relative Rotation Graph. The fact that the RRG-Lines are normalized and comparable makes it possible to plot ALL elements of a universe on one plot. In that way providing the user with "the BIG picture in ONE picture".
Similar RS-Ratio or RS-Momentum values can occur at different locations on the RRG chart
Again back to the (last part of the) original question. Due to the fact that a Relative Rotation Graph combines two measures and plots them on one "canvas", the same numerical value of one of the RRG-Lines can have different meanings/implications depending on the corresponding value of the other indicator at the same time.
The RRG below should clarify this.
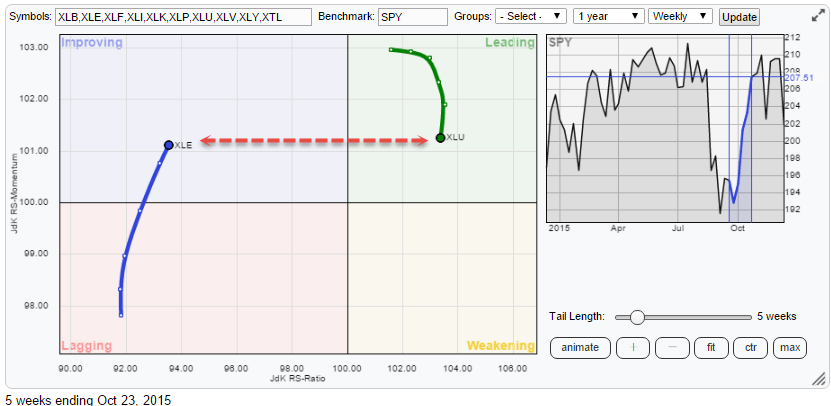
As you can see the JdK RS-Momentum values for XLE and XLU are (almost) the same at this point in time. However, the value of the JdK RS-Ratio positions the two sectors at completely different positions on the graph.
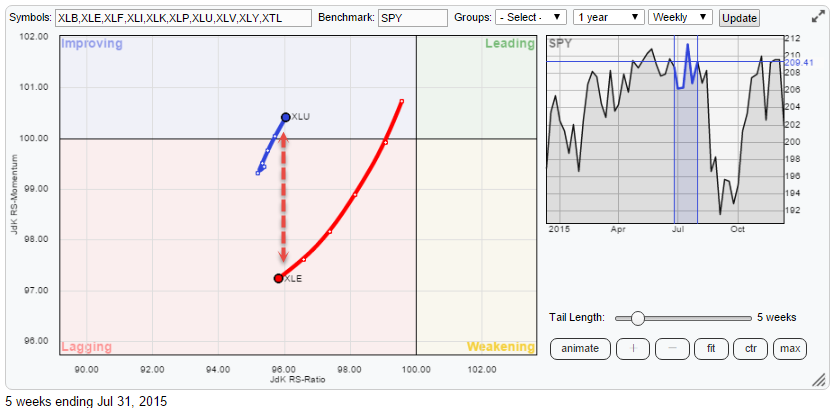
A similar situation can occur for two sectors showing (almost) the same RS-Ratio value.
Primarily a visualization tool
And this, finally, brings me to the most important aspect of Relative Rotation Graphs. They are primarily a visualization tool. RRGs will help users to get a handle on the interaction, the rotation, and the relative movement, of all the elements inside a universe in a way that no tabular format will ever be able to show you.
They were never intended, nor designed, as a "trading system" nor do they have any fixed "trading rules." When I present RRGs, I always try to position them as one of the tools in our toolkit as technicians. I like to use them to keep an eye on the big picture of relative movement that is going on inside a specific universe. And then quickly and easily pick the securities that I would like to analyze further. Maybe because they are moving far away from the benchmark towards the outside of the RRG or they show a particularly long or short trail or they have moved almost "off the radar" and then subtly start to turn back up or down etc. etc.
The next step, as you may have noticed in my blogs, is then always to connect the move on the RRG back to actual price chart to make up my mind. This has to do with the simple reason that, just like you cannot "buy the RSI or the MACD" you can also not "buy the RRG."
Eventually, the trade needs to be done in the stock or the ETF or whatever instrument you are analyzing, and so they should be the final step in the analysis before you pull the trigger.
Julius de Kempenaer | RRG Research
RRG, Relative Rotation Graphs, JdK RS-Ratio and JdK RS_Momentum are registered TradeMarks by RRG Research
Read more on Relative Rotation Graphs in these Chartschool articles:
