RRG Charts February 26, 2016 at 01:33 AM
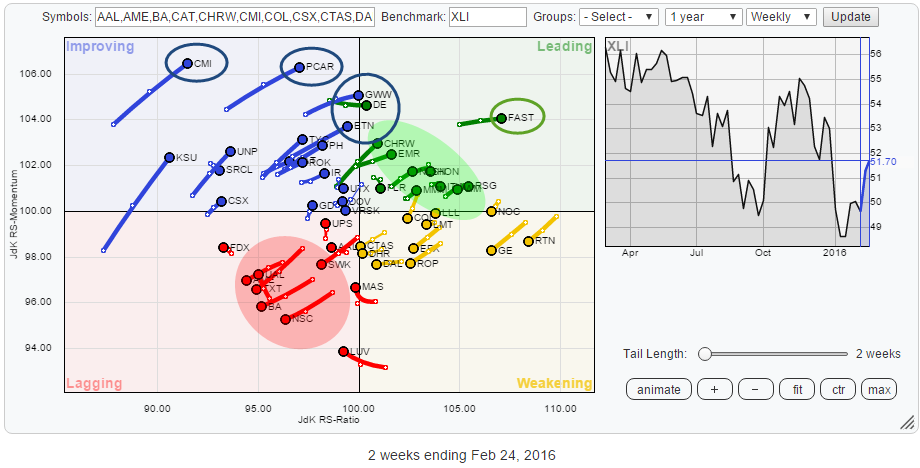
The Industrials sector, XLI, itself is positioned near the center of the Relative Rotation Graph holding all the sector ETFs that make up the S&P 500 index... Read More
RRG Charts February 13, 2016 at 11:14 AM
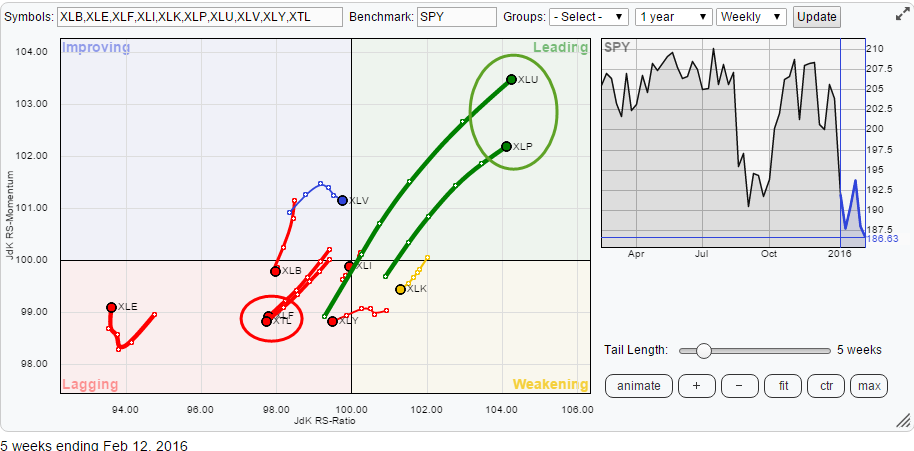
Since the beginning of the year, the internal characteristics of the S&P 500 universe are characterized by strong sector rotation. The Relative Rotation Graph below shows the sector rotation over the past five weeks. A few sectors are standing out and worth a further inspection... Read More
RRG Charts February 08, 2016 at 08:52 AM
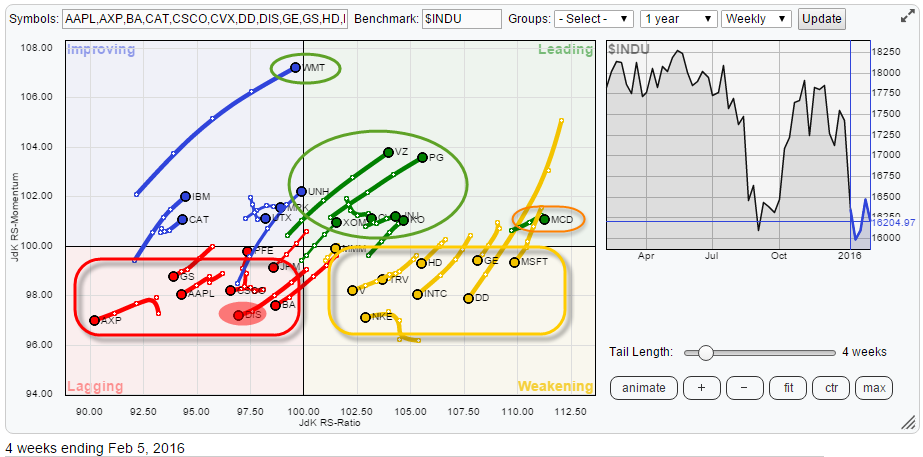
Over the past few days I have been looking at the Relative Rotation Graph of the 30 Dow stocks and its individual charts, and quite frankly I don't even know where to begin. Big swings all over the place, from +6% in DD to -9% in MSFT and anything in between... Read More