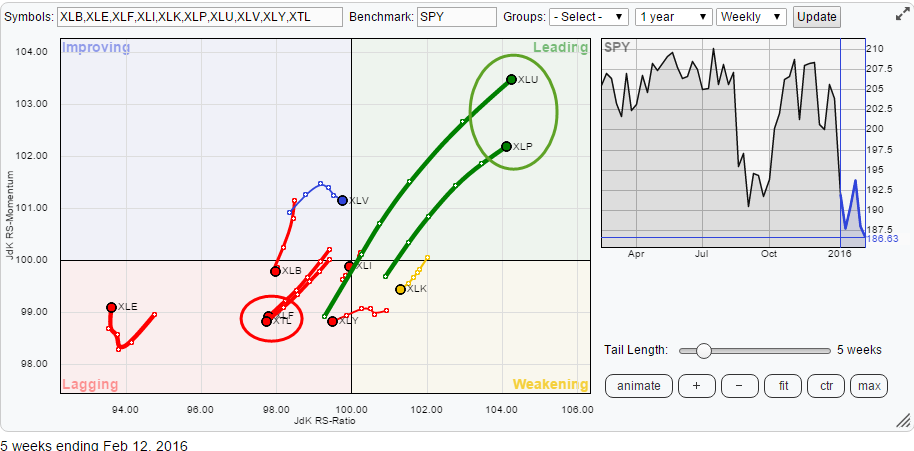
Since the beginning of the year, the internal characteristics of the S&P 500 universe are characterized by strong sector rotation. The Relative Rotation Graph below shows the sector rotation over the past five weeks. A few sectors are standing out and worth a further inspection.
Summary
- XTL expected to weaken further
- XLF could go as low as $ 17 (- 15%)
- XLU & XLP likely to continue to outperform SPY
Quick scan
Clearly Utilities (XLU) and Consumer Staples (XLP) are standing out as they are shooting off further into the leading quadrant and both are showing long tails.
Almost exactly opposite of XLU and XLP we find Financials (XLF) and Telecom (XTL) which are both heading lower on both axes of the Relative Rotation Graph and therefore, deeper into the lagging quadrant.
Furthermore, there is Energy (XLE) showing an upward turn inside the lagging quadrant but still far away from the 100 mark on JdK RS-Ratio and more or less detached from the other sectors on the graph. Technology (XLK) is rotating South-West inside the weakening quadrant but is doing that with a short tail. And then there is Health Care (XLV) which underwent a strong rotation in December and January but started to level off in February.
Telecom - XTL
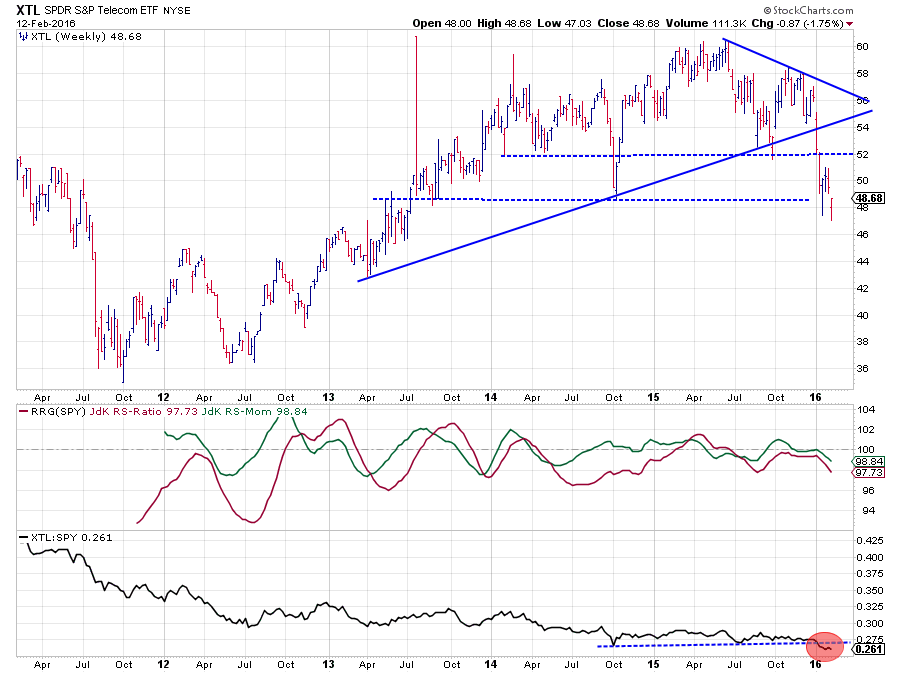 During the last few months of last year, both the JdK RS-Ratio and the JdK RS-Momentum lines moved flat following the sideways behaviour in the raw RS-Line. The fact that the JdK RS-Ratio moved flat below the 100-mark indicated that a light relative downtrend was underway.
When XTL broke its rising support line and started to accelerate downward, the relative picture began to weaken further as well. The RS-Line dropped below its horizontal support level pushing to the lowest relative strength levels since the introduction of XTL. From a relative point of view, more weakness seems to lie ahead for Telecom stocks.
On the price chart, XTL is trying to find support near $ 48 which is the level of the 2014 low and a cluster of high-low rotation in 2013. For the time being the weekly closes in XTL managed to remain above this support. The upward potential, however, is limited to the previous horizontal support level, turned into resistance, near $ 52.
The combination of limited upward potential, increased downward risk, especially when $ 48 gives way, and a weak relative strength picture makes Telecom a sector to avoid for now.
Financials - XLF
 The tail of the Financials sector (XLF) on the RRG is almost identical to the tail that we saw on XTL. From a market cap point of view, however, the contrast between the two sectors could not be much bigger.
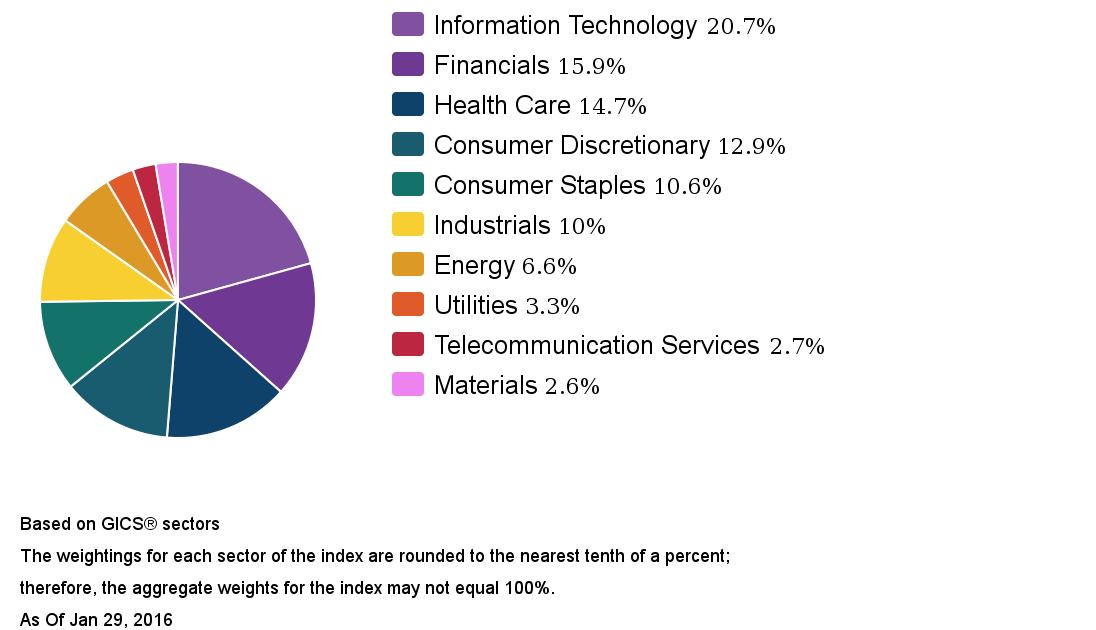 The pie chart on the right comes from the S&P Dow Jones Indices website and shows the breakdown of the ten sectors that make up the S&P 500.
Financials is the second biggest sector at 15.9% while Telecom services is the second smallest at 2.7%. Needless to say that the impact of a move in Financials will have a lot more impact on the direction of the general market as such.
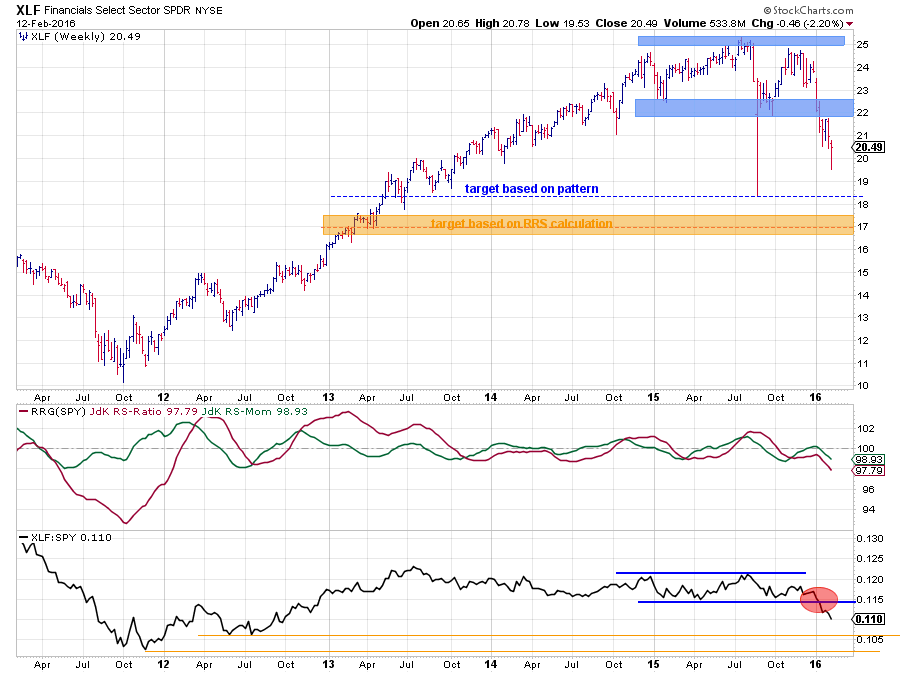
It does not take a lot of time, nor technical analysis skills, to classify the chart of the Financials sector as "weak", it's pretty obvious...
On the chart, a few big moves/trends can be distinguished. Out of the 2011 low, a strong uptrend emerged that brought the sector to a high around $ 24.50 at the end of 2014. The whole of 2015 can be classified as a sideways move with one attempt to peek above $ 25.00, but that failed quickly. During the year, a range has been built up between roughly $ 22 on the downside and $ 25 on the upside.
Immediately after the start of 2016, the sector started to decline and broke below the lower boundary, causing an acceleration to lower levels that is still underway. By using classical technical analysis guidelines, and projecting the "height" of the range below the breakout level, a price target for XLF can be pegged near $ 18.50 - $ 19.00.
The relative strength for XLF already started to weaken back in October of last year when the RS-Ratio line dropped below 100, suggesting that a (new) relative downtrend had started. This downtrend in relative strength got confirmed when the raw RS-Line broke out of its trading range and started to accelerate.
This break in relative strength caused the rise in RS-Momentum to be short-lived, topping out near 100 and the RS-Ratio setting a high below the 100-level. Add that to the already negative outlook based on the price chart and we have a pretty negative cocktail of events that does not promise a lot of good.
Reverse Relative Strength calculation for XLF
In two previous blogs here and here, I introduced "Reverse Relative Strength Calculation". In those posts, I used this to arrive at a price target for the general market. Today I want to apply the same approach to get to a target for XLF.
In the two articles mentioned above, I arrived at price targets for SPY at $ 162.69 and $ 165.38. The first target has now been satisfied which leaves $ 165.38 as the next one to watch.
To use this approach, we need two out of the three ingredients for a relative strength calculation. If we want to get a target for XLF, then we need targets for the RS (XLF:SPY) and the price of SPY.
Looking at the relative strength line in the chart above and based on the break, out of the range, I can see two potential targets for RS. These are based on the important lows at the end of 2011 (0.1020) and in May-July of 2012 (0.1060). Using $ 165 as the target for SPY this implies a price target for XLF of:
0.1060 * $ 165 = $ 17.49
or
0.1020 * $ 165 = $ 16.83
Let's see what happens.
Consumer Staples - XLP
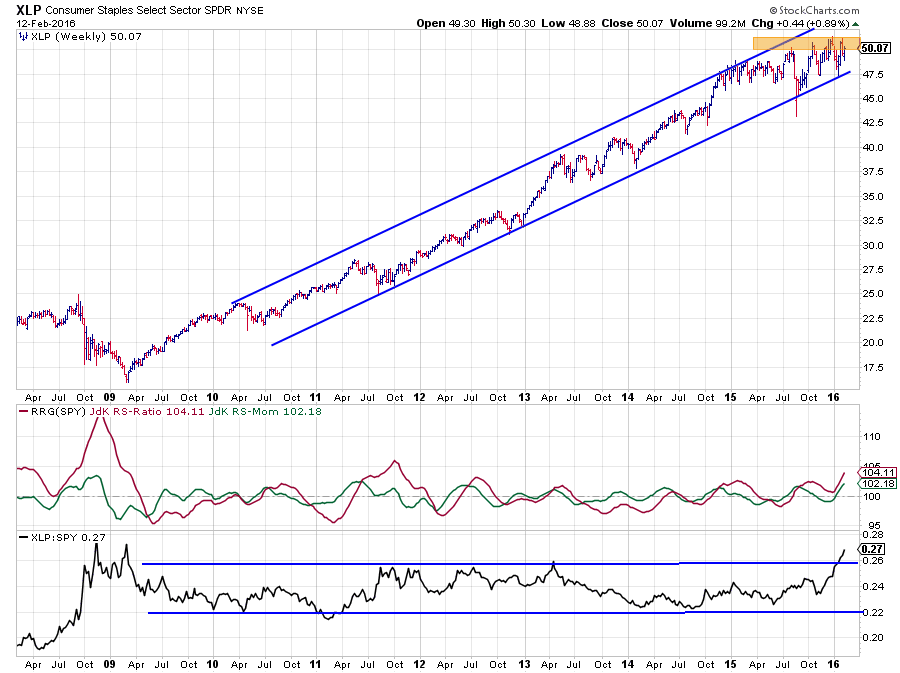 Consumer Staples is still trading inside a long term rising channel which emerged out of the 2009 low. Since the beginning of 2015, the volatility inside the channel has increased, and it has interrupted the series of higher highs and higher lows. Despite that, the channel is still intact. The area between $ 50 - $ 51 is now starting to play up as a resistance zone and has been tested three times.
On the relative chart, things started to look better in the second half of 2014 when the RS line tested the lower part of the range. The JdK RS-Ratio line crossed above 100 again halfway through 2015 and recently put in a new low above 100 which indicates that a (strong) relative uptrend is underway. Especially during the last few months, this can be seen well in the RS-Line as it is successively taking out previous highs and has now broken above the upper boundary of the trading range.
This means that there is now plenty of room on the upside for the relative strength line to rise further. The downside risk for XLP is limited as it is still trading inside the trend-channel. So even if SPY continues to fall and relative strength for the Consumer Staples sector will continue to rise, XLP should be able to remain within the boundaries of the rising channel.
Staples vs. Discretionary - XLP:XLY
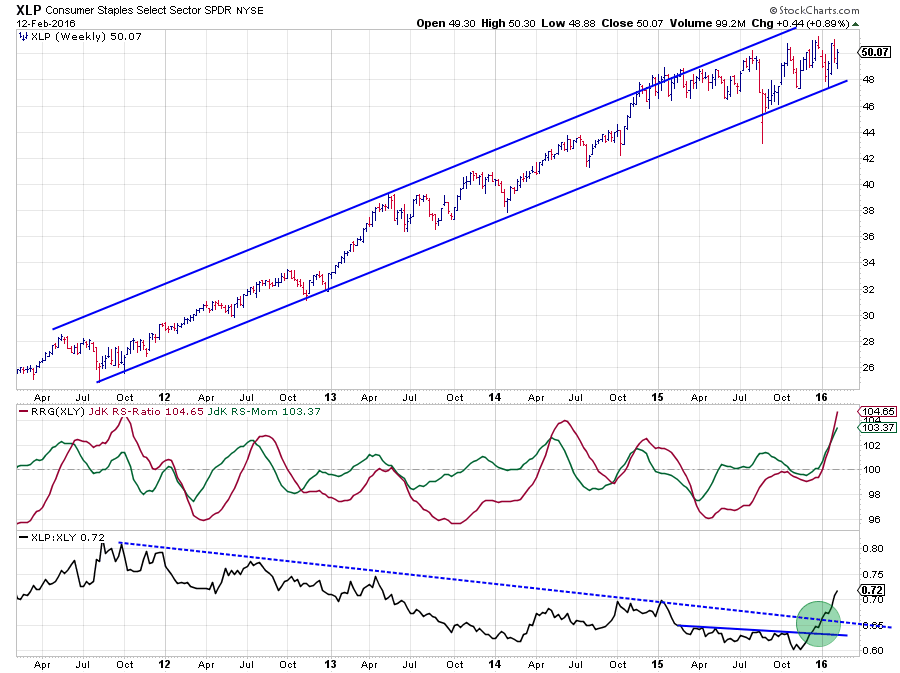 A quick look at the sector rotation of Staples vs. Discretionary shows that the relative strength of XLP:XLY started to accelerate after the ratio first broke the horizontal barrier and then pierced through the falling resistance line (dashed blue).
This reinforces the view that investors should have a preference for defensive sectors in current market conditions.
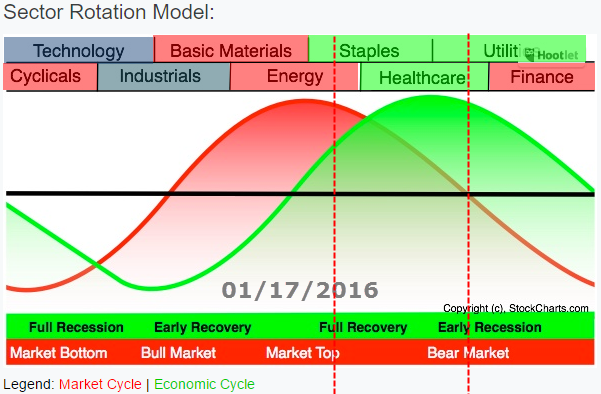
Putting the relative positions/trends for the various sectors into the sector rotation model as seen on the chart below, suggests that the "economy" is transitioning from a full recovery towards early recession putting the "market" in the first part of a bear-market.
Utilities - XLU
 The other sector showing a strong rotation on the Relative Rotation Graph is Utilities. The price chart, in combination with the RRG-Lines and relative strength line, however, is quite different from the XLP chart.
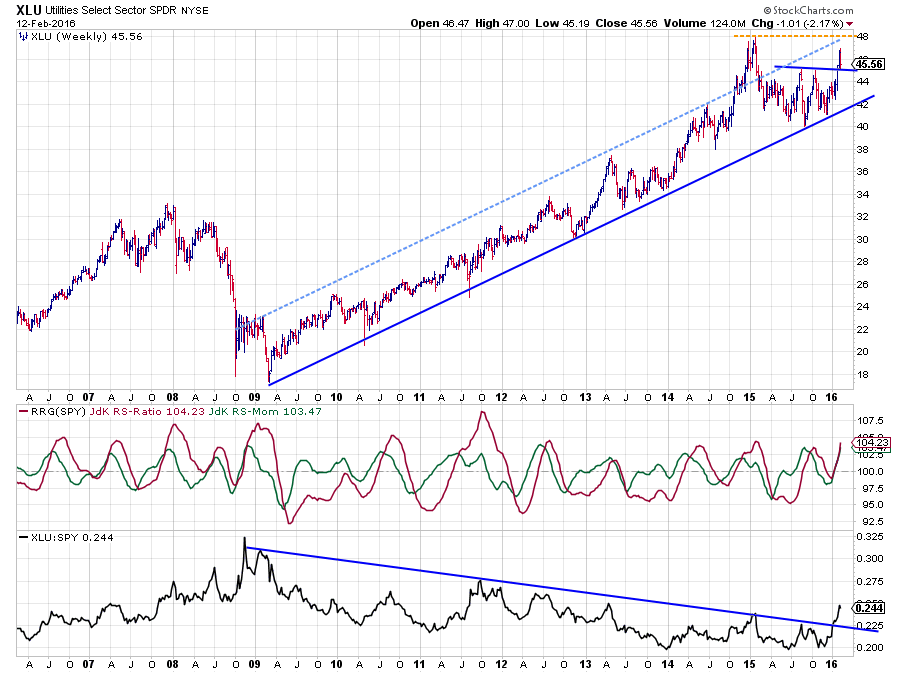
On the price chart, there is also a nice rising trend visible but here the peak was already reached at the beginning of 2015 after a brief, acceleration out of the channel. Afer the drop back into the boundaries of the channel and the subsequent test of the lower boundary XLU moved sideways in a volatile fashion. Just recently he previous two peaks near $ 45 was taken out to the upside which is positive sign as it puts Utilities comfortable within the boundaries of the rising channel and t also limits the downside risk for the time being as the previous resistance is now expected to start acting as support.
The big difference is found in the relative charts, especially the raw relative strength line. Since the start of the rising trend at beginning of 2009, relative strength started to fade, resulting in a long series of lower highs. This move perfectly underscores the defensive characteristics of this sector, being an underperformer during the strong rise of the general market.
Things have changed now. With the general market under pressure, Utilities s one of the sectors to shine, and so it does. The upward break above the down sloping resistance line on the RS chart is a clear sign of improvement (relative) and suggests that there is more to come.
Just like XLP, the Utilities sector should be able to maintain its position within the boundaries of the rising channel during a decline in SPY and thus push the relative strength (XLP:SPY) higher.
Room to manoeuvre
The position of XLP and XLU on the RRG indicates that their relative trends are established and well underway, it also has created the opportunity for both sectors to go through a corrective period (relative weakness) without immediately hurting their new relative uptrends.
On the other side of the RRG this is definitely also the case for XLE and to a lesser extend for XLF and XTL.
Julius de Kempenaer | RRG Research
RRG, Relative Rotation Graphs, JdK RS-Ratio and JdK RS-Momentum are registered TradeMarks by RRG Research
Follow RRG Research on social media:
LinkedIn Facebook Twitter
