RRG Charts April 30, 2016 at 06:55 PM
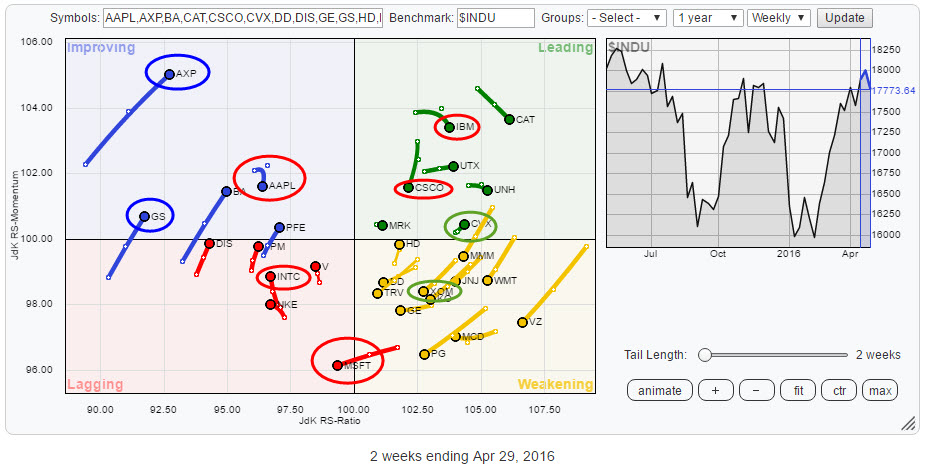
This Relative Rotation Graph holds the constituents of the Dow Jones Industrials Average ($INDU) and shows the position and movement of their relative trends against $INDU and each other... Read More
RRG Charts April 25, 2016 at 06:39 AM
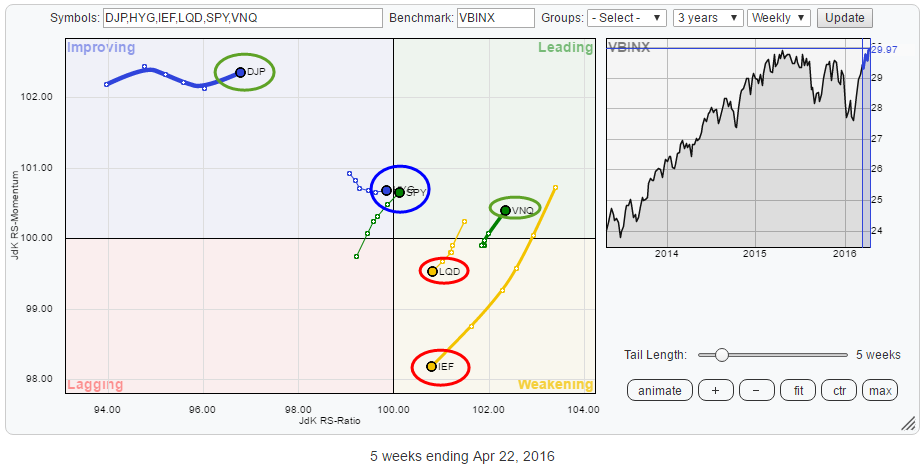
The Relative Rotation Graph below shows the rotational picture for a number of asset classes, based on ETFs, against the Vanguard Balanced index fund on a weekly basis... Read More
RRG Charts April 16, 2016 at 05:44 PM
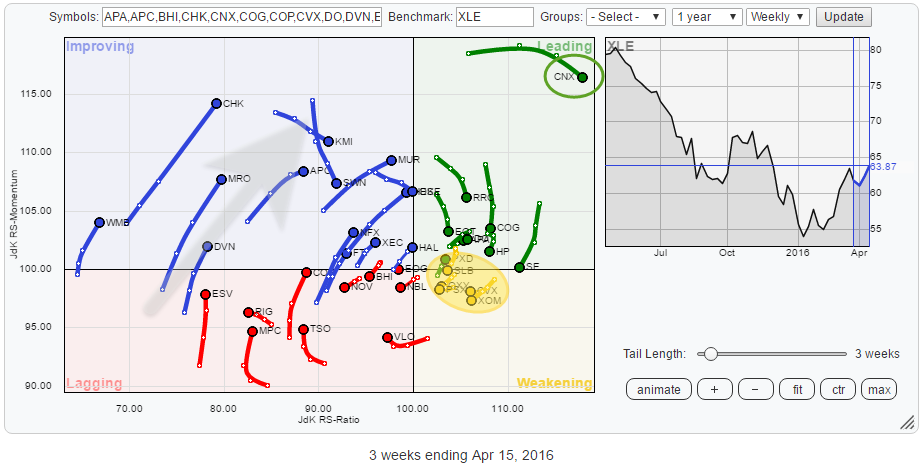
The energy sector has been a very poor performing sector for a very long time. However, on the Relative Rotation Graph for US sectors (ETFs), XLE is now way up inside the improving quadrant and heading right towards leading... Read More