RRG Charts September 27, 2016 at 11:27 PM
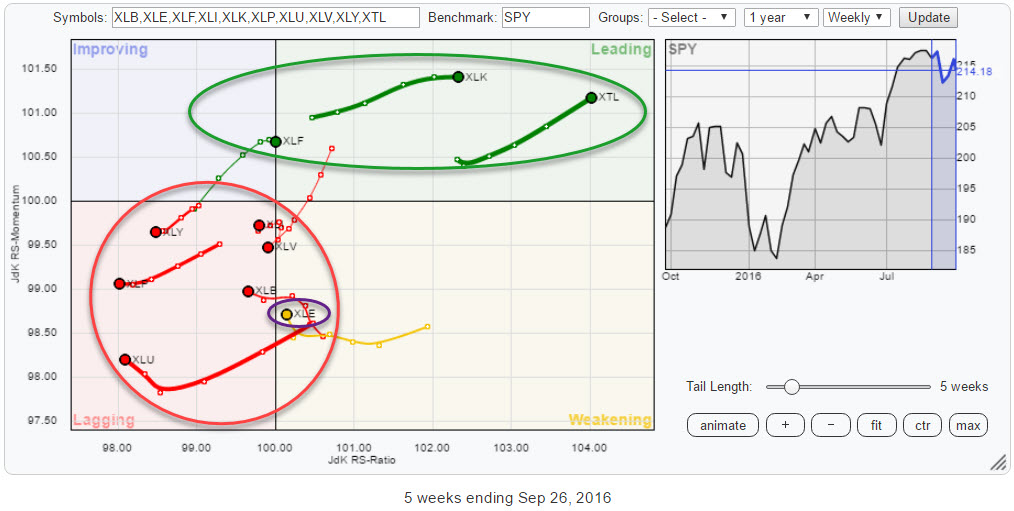
The Relative Rotation Graph above shows the sector rotation for ten US sector ETFs. The new REITs sector ETF is not included yet due to a lack of historical data points... Read More
RRG Charts September 21, 2016 at 02:05 PM
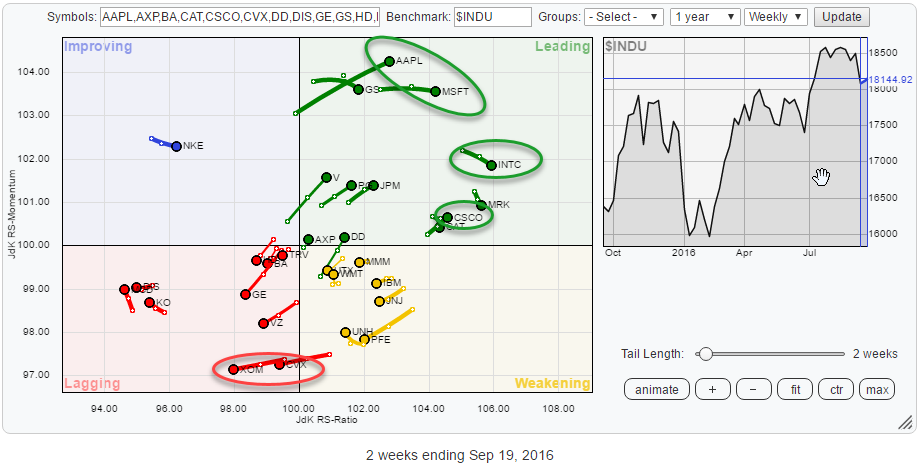
The Relative Rotation Graph below holds the components of the Dow Jones Industrials index vis-à-vis the $INDU index. The one observation that immediately stands out to me is the domination of technology stocks inside the leading quadrant... Read More