RRG Charts December 30, 2016 at 12:50 PM
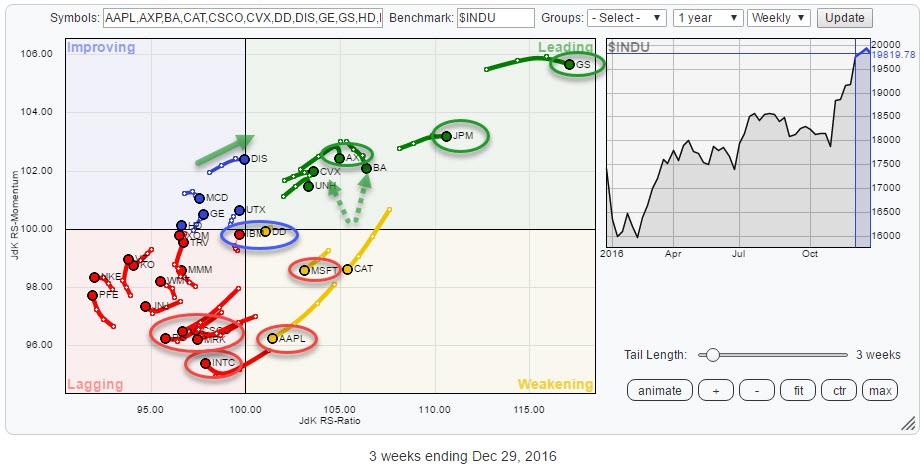
From July to November of this year Tech stocks have dominated the performance of the Dow Jones Industrials Index ($INDU) but then came November! The Relative Rotation Graph of all DJ Industrials stocks below shows the rotational pattern of all $INDU members with a three-week tail... Read More
RRG Charts December 19, 2016 at 05:40 AM
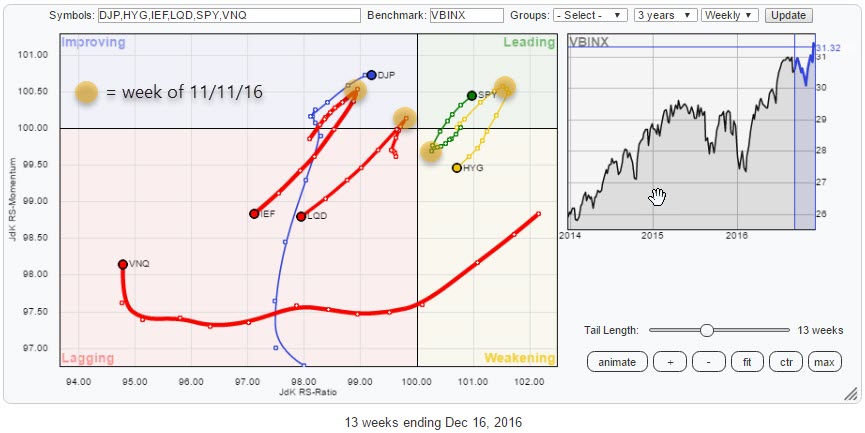
My last article on asset allocation was posted just before election day (11/8), and I was not happy about the rotation for equities against bonds... What a difference a week makes... Read More
RRG Charts December 13, 2016 at 09:52 AM
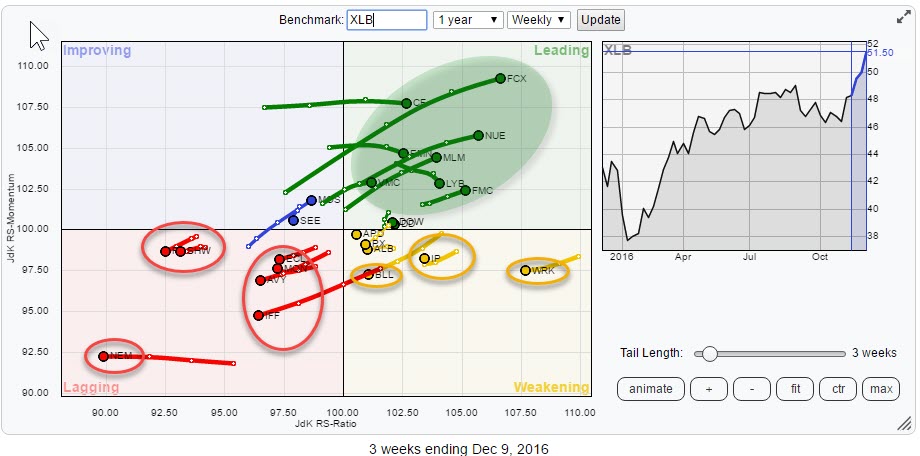
Last weeks RRG blog looked at the sector ETFs that make up the S&P 500 index. Materials, the XLB ETF, came out as one of the, more promising, sectors on its way to the leading quadrant. In this post, I will look into the individual stocks that make up that materials sector... Read More
RRG Charts December 05, 2016 at 06:25 AM
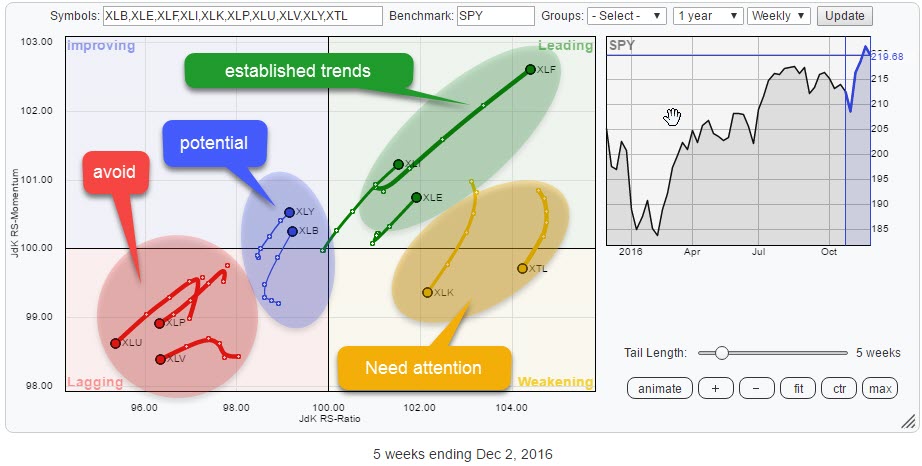
The Relative Rotation Graph above shows the rotational picture for US sectors. For a change the rotations are well defined and clearly visible, which immediately raises the question; " For how long?" I will try to answer the question, but no-one ever said it was easy.... Read More