From July to November of this year Tech stocks have dominated the performance of the Dow Jones Industrials Index ($INDU) but then came November!
The Relative Rotation Graph of all DJ Industrials stocks below shows the rotational pattern of all $INDU members with a three-week tail.
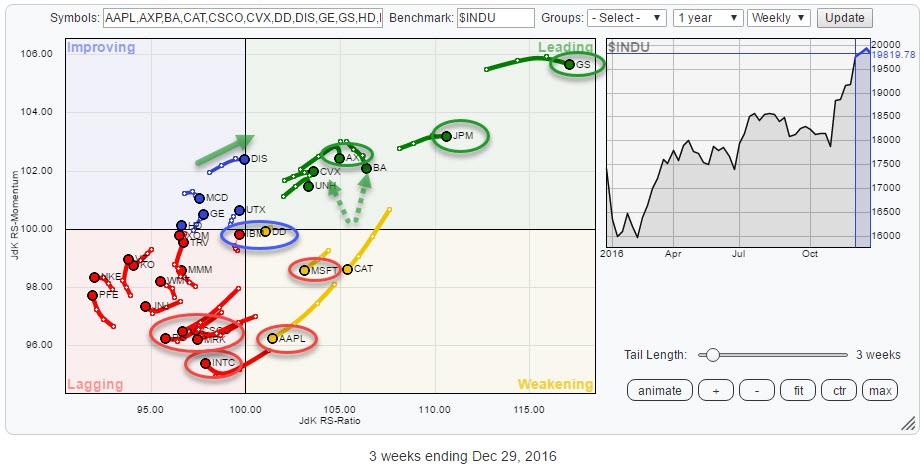 The recent weakness for Technology and the subsequent takeover of sector rotation towards Financials is clearly visible on the RRG.
Summary
- Sector rotation from Technology to Financials clearly visible on RRG
- Leading quadrant dominated by Financials since November
- Technology stocks rotating at negative headings
- AAPL stalling near $ 120 and heading for a crossover into the lagging quadrant
- INTC sending mixed signals
- IBM leading other tech stocks by a few months
- BA breaking to new highs but probably needs a breather from a relative perspective
- CVX showing strong relative strength, any decline off current resistance offers renewed entry opportunities
- DIS needs to break $ 105 to push into the leading quadrant and continue its outperformance
Quick scan
Financials, especially GS, JPM, and AXP continue to dominate the DJ Industrials index' performance as they are pushing deeper into the leading quadrant. The last RRG blog covering the DJ Industrials universe looked at the Financials sector in depth and the observations there are still pretty actual today.
The slight loss of relative momentum is not worrying yet but needs monitoring in coming weeks as it will clearly have an impact on general market performance.
At the moment the accelerating weakness of the technology stocks is catching the eye. Especially the long tails on AAPL and INTC indicate that there is power behind the moves.
IBM is positioned very close to the benchmark and seems to be the only tech stock not moving lower o the JdK RS-Ratio scale and has a very short tail worth a further inspection.
Of the remaining stocks on the graph, BA and CVX inside the leading quadrant have an interesting rotational pattern. Inside the improving quadrant, but very close to crossing over into leading DIS deserves a better look.
Zooming in on Technology members
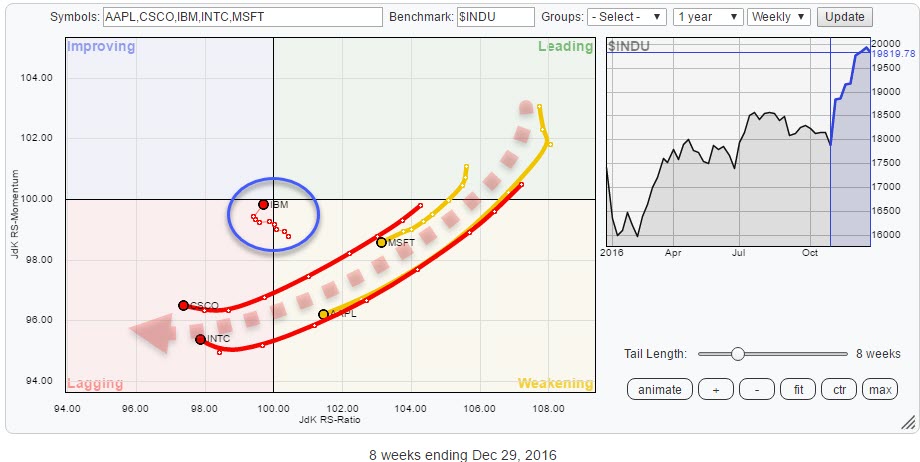 The RRG above holds the five technology stocks in $INDU showing an eight week tail. The tails and rotational pattern of CSCO, INTC, AAPL and to a lesser extend MSFT leave little doubt.
IBM seems to be the odd one out at the moment, almost exactly on the benchmark and a deviating heading compared to the others.
Apple Inc - AAPL
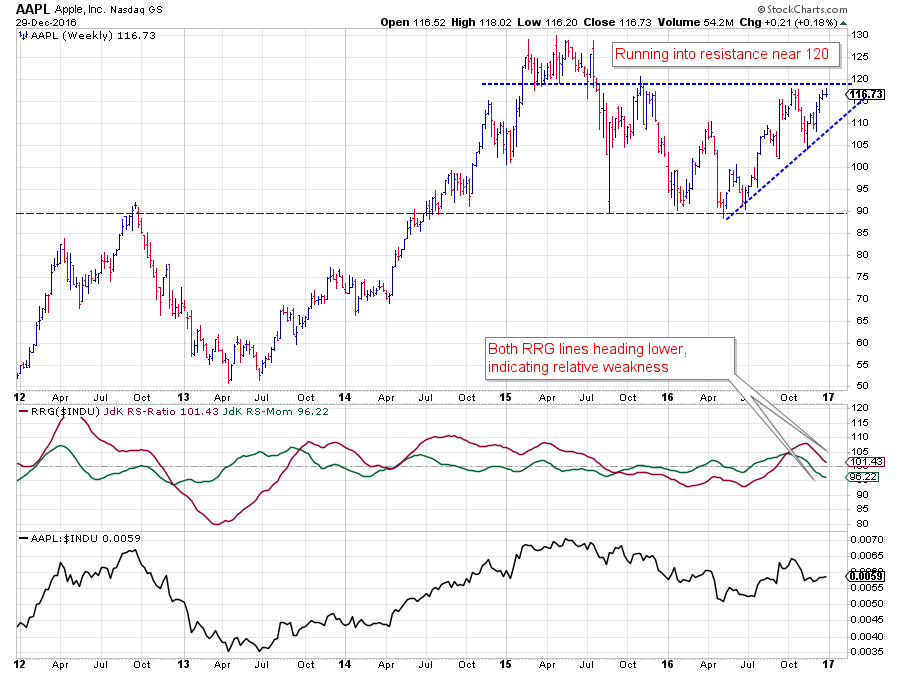 The BIG one in the technology sector here is AAPL.
On the price chart, the stock is running into resistance near $ 120 which is a level that has played a role on either side for AAPL over the past two years. At the moment $ 120 is also the level of the most recent high which usually is a natural resistance level.
Clearly, a break higher would be positive but what are the odds?
Looking at the relative charts in the bottom two panes there is not much strength visible for AAPL. At least not for the short term.
The raw RS-Line has set a lower high in October and declined over the past few weeks. This has been picked up bu the RRG-Lines that are now both moving lower, positioning AAPL inside the weakening quadrant and close to crossing over into lagging.
The steepness of the relative decline causes a long tail which indicates that there is strength behind the move. This calls for caution regarding the relative performance of AAPL in coming weeks.
Intel Corp - INTC
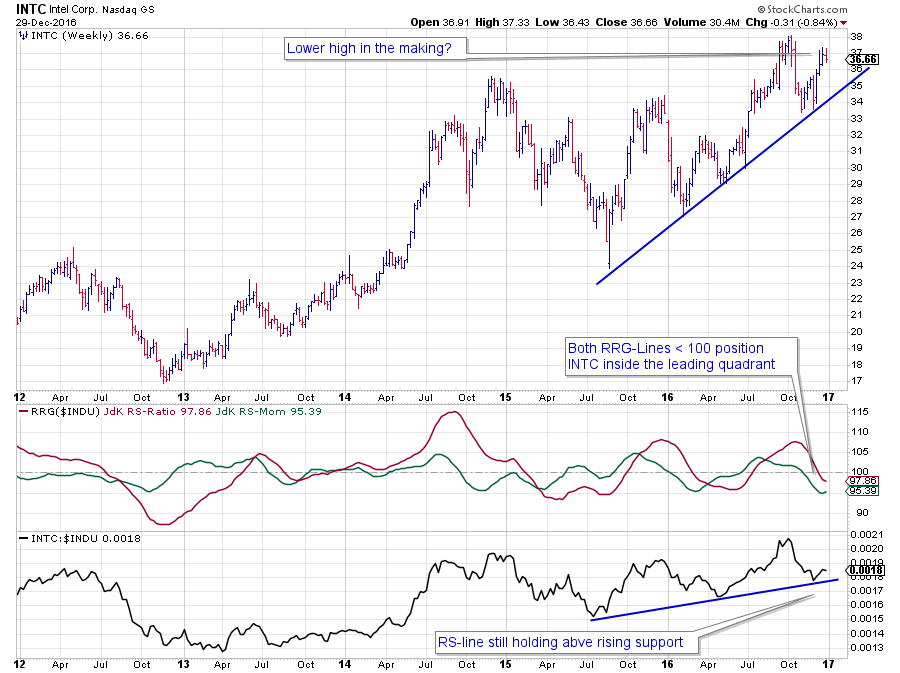 Intel is sending mixed signals. Both RRG-Lines are below 100 which puts the stock well inside the lagging quadrant, backed by a long tail.
The steepness of the decline in relative strength since its peak in October causes a long tail on the RRG. Very recently, however, the RS-Lines touched a longer-term support line which needs to be broken for the weakness in relative strength to continue.
A catalyst for a break in relative strength could be a decline in price and what we see in the price chart is a potential lower top in the making. If this materializes and INTC will start to move lower, this will very likely have a negative effect on relative strength and push the stock deeper into the lagging quadrant.
International Business Machines - IBM
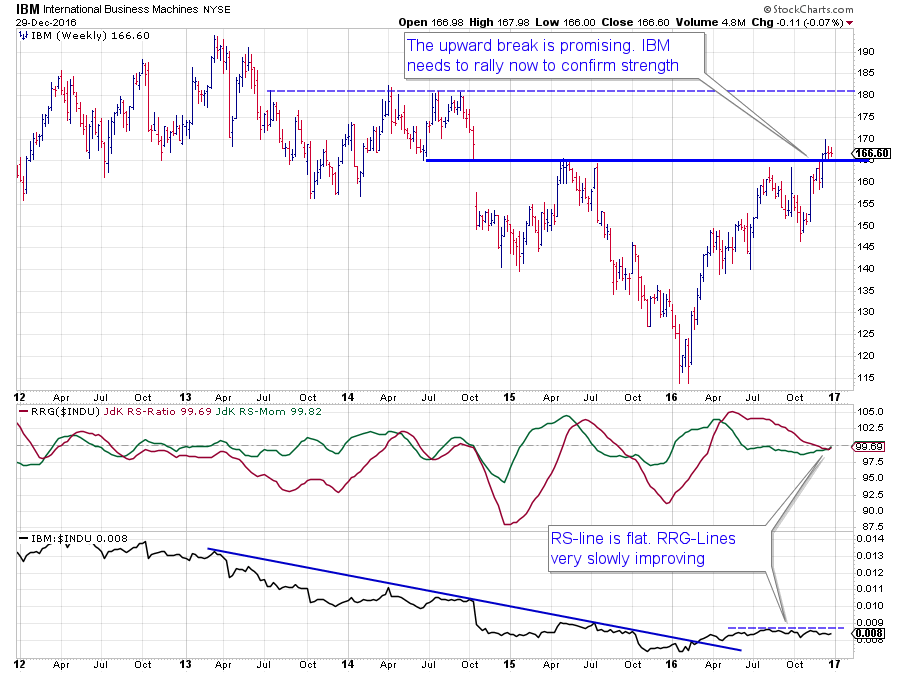 Big Blue is bucking the current trends in technology.
On the price chart, IBM recently took out its horizontal resistance level around $ 165, and one could even argue that this completed a very big inverted Head and Shoulders pattern, spanning almost two years and suggesting a $ 50 rally off of current levels.
I am not going to make such a bold statement right away, but I will keep it in the back of my mind as a positive for IBM going forward.
From a relative perspective, IBM seems to be leading the other four technology stocks in the DJ Industrials Index. If you step through the historical rotation, you can see that IBM led the sector into the leading quadrant in April of this year and was the first one to start weakening in the period from June to November before crossing over into lagging in the early days of December.
This week's rotation shows IBM "hooking" back to an N-NE heading while positioned right in the middle of the chart on the benchmark which is a (mildly) positive signal. Especially the combination with the improvement on the price chart makes IBM worthwhile to keep an eye on in coming weeks.
If IBM continues its lead within technology, then that is the stock to pick within the sector as the others may be expected to keep lagging at least for a little while longer.
Interesting rotations in improving and leading
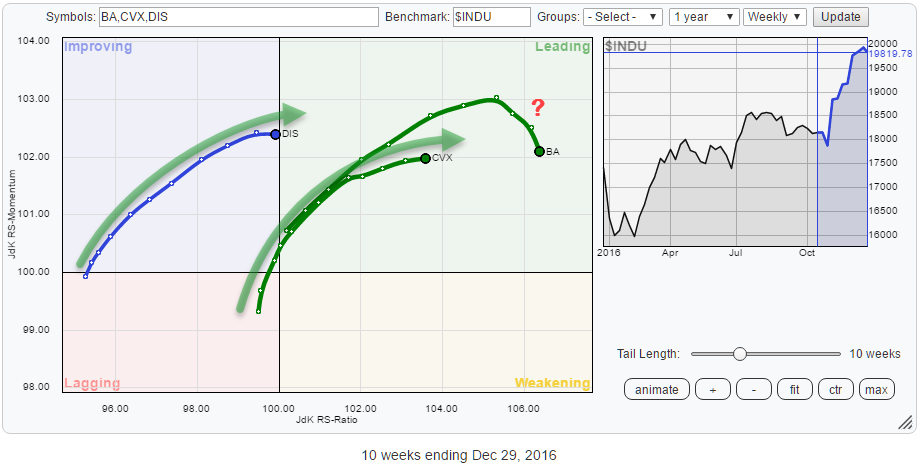 Zooming in on a few potentially interesting rotations inside the improving and leading quadrants points to three stocks that deserve a bit more attention.
These are BA and CVX inside the leading quadrant and DIS inside improving.
BA has started to lose a bit of relative momentum over the past few weeks but is still at a high level on the RS-Ratio scale. CVX is solidly positioned in the leading quadrant and still gaining on both axes while DIS shows a very nice tail at an almost 45 degree heading just about to cross over into the leading quadrant.
Boeing Co. - BA
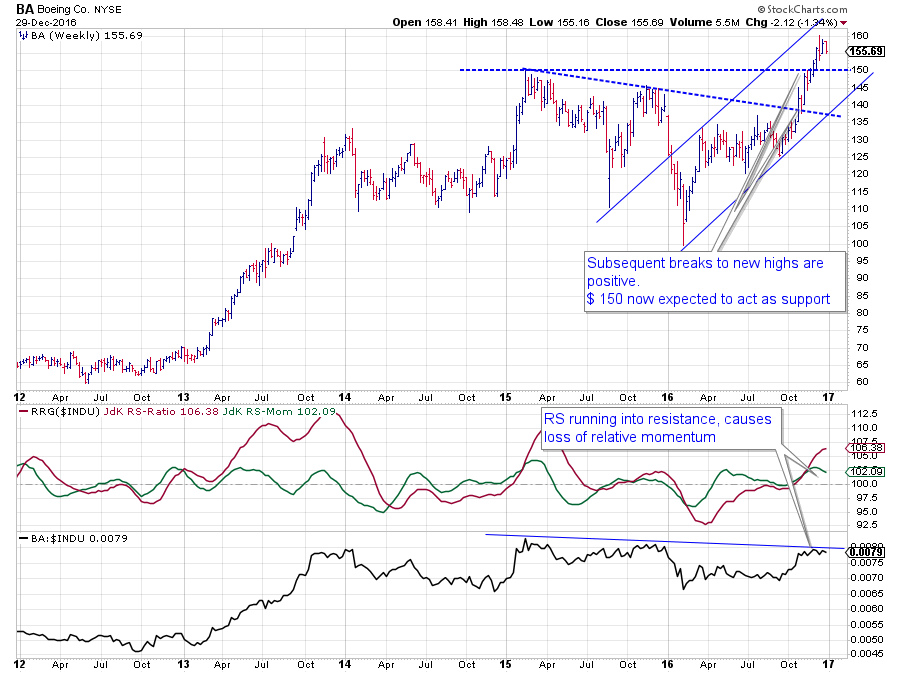 After having been under pressure from the falling resistance line coming off the 2015 peak, BA started to show relative strength against the DJ Industrials Index early October when the RRG-Lines moved above 100 in tandem.
The first sign of improvement on the price chart came late October when the falling resistance line gave way, followed by a second bullish break when BA pushed to new highs above the horizontal resistance level of the 2015 peak at $ 150.
These improvements have cleared the path for further upside movement while the downside is well protected around the $ 150 area.
At the moment the struggle of the RS-Lines with its slightly down-sloping resistance is pausing the relative rally and causing the tail to bend down over the past three weeks.
Given the high reading on the JdK RS-Ratio scale, this is not too worrisome yet and judged as a temporary setback. This makes BA a good candidate to watch for a rotation on the right side of the RRG, offering a good re-entry moment when the RRG-heading starts to move into the 0-90 degree area again.
Chevron Corp. - CVX
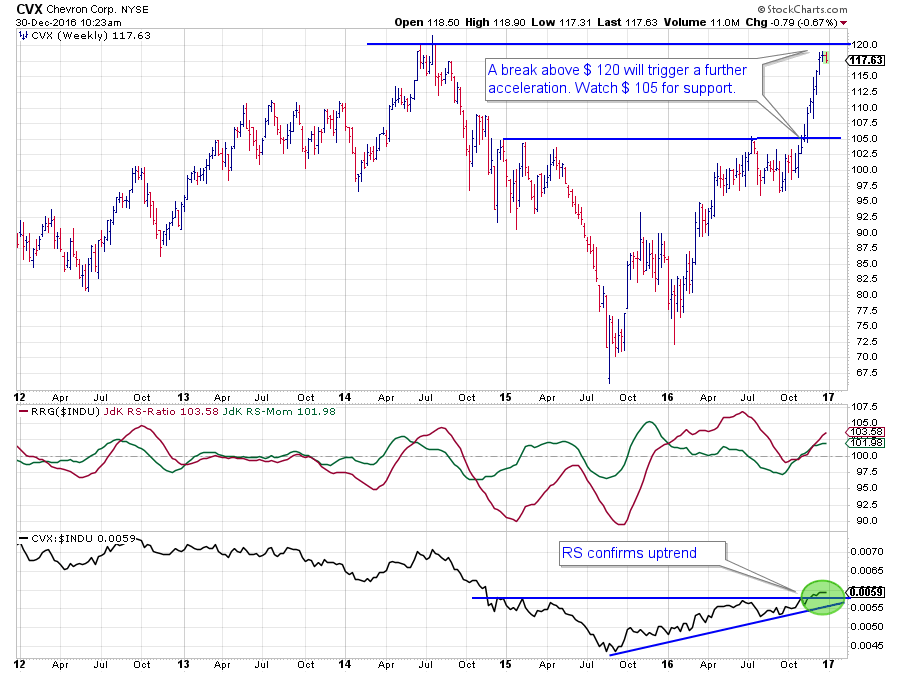 CVX has been steadily moving higher on both axes of the RRG chart, powered by a steep rally after breaking resistance near $ 105 on the price chart.
Overhead resistance is expected around $ 120 and already starting to show up with the highs of the past three weekly bars around the same level. As a result of the steep rise, support is now pretty far away from the current price level which makes a temporary setback increasingly likely.
With relative strength breaking above its horizontal resistance and both RRG-lines continuing higher on both axes such a setback will be a renewed buying opportunity to get on board at lower levels.
Clearly, a break beyond the all-time high at $ 120 will trigger a further acceleration of the rally and push CVX into uncharted territory. From a relative perspective, there is plenty of upside potential left to follow such a move as the RS-Ratio line of CVX vs. $INDU typically peaked in the 106-107 area over the past years.
Walt Disney Co. - DIS
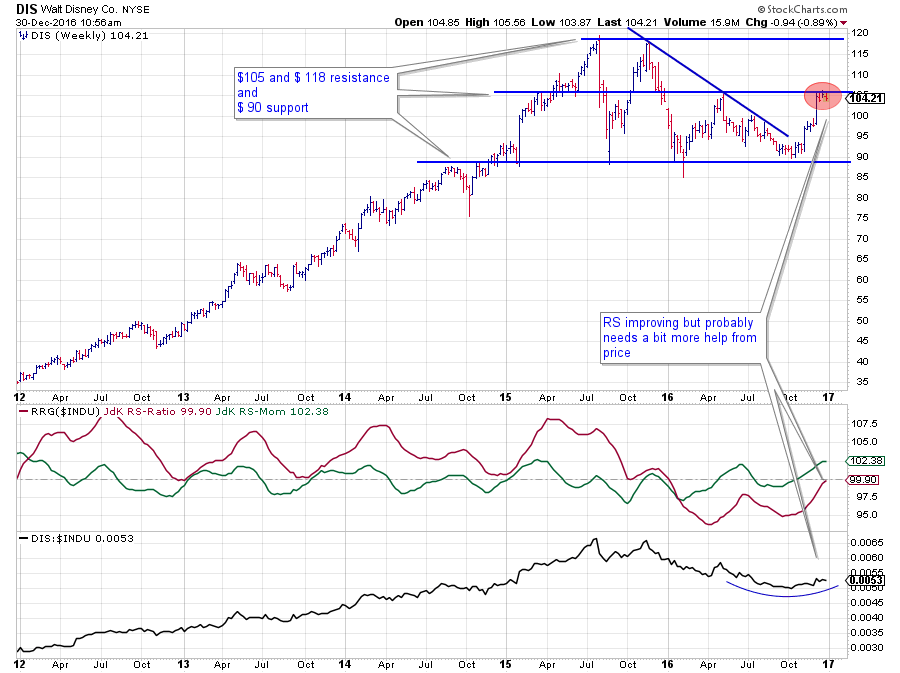 Disney's price action over the past two years played out between $ 90 - $ 120 with $ 105 showing up as a significant level in the middle (well almost).
Th area around $ 90 has proven itself as a solid floor where demand seems to be coming back (=support). After the last test of that support level, Disney rapidly rallied to the, now, resistance area around $ 105 and so far has not been able to break higher in the past three weeks.
From a relative perspective, DIS has been in a downtrend against the DJ Industrials index, but this is coming to an end. On the RS chart, a rounding bottom is emerging while the JdK RS-Momentum line has already crossed above 100 and RS-Ratio is following suit.
What is needed for this improvement in relative strength to continue higher is a break beyond $ 105 on the price chart. If such a break does not materialize a rotation back into improving and maybe even lagging is possible. A break above $ 105 will very likely make DIS one of the best stocks inside $INDU.
As this is my last post for 2016 I would like to take the opportunity to thank all StockCharts.com users and readers of my blog for your support and feedback in the past year and wish all of you a very happy New Year and a smashing 2017 with lots of profitable investments. I am looking forward to another year of RRG-blogs with new ideas and research based on Relative Rotation Graphs.
Please keep your comments and feedback coming and if you have any ideas on how I could improve the content, don't be shy. If you want an alert every time a new article has been posted, leave your e-mail address and click the green "Notify Me!" button below this article.
Julius de Kempenaer | RRG Research
RRG, Relative Rotation Graphs, JdK RS-Ratio and JdK RS-Momentum are registered TradeMarks by RRG Research
Follow RRG Research on social media:
