Summary
- XLK only sector inside leading quadrant for S&P 500 universe
- QCOM nosediving inside Lagging quadrant
- NVDA rapidly losing its top position within the sector
- WDC tracking MU lower into the weakening quadrant
- GLW providing excellent example of stable uptrend (price and relative)
- ADBE pushing into leading from improving
- AAPL and SWKS rotating back into leading from weakening
Quick scan
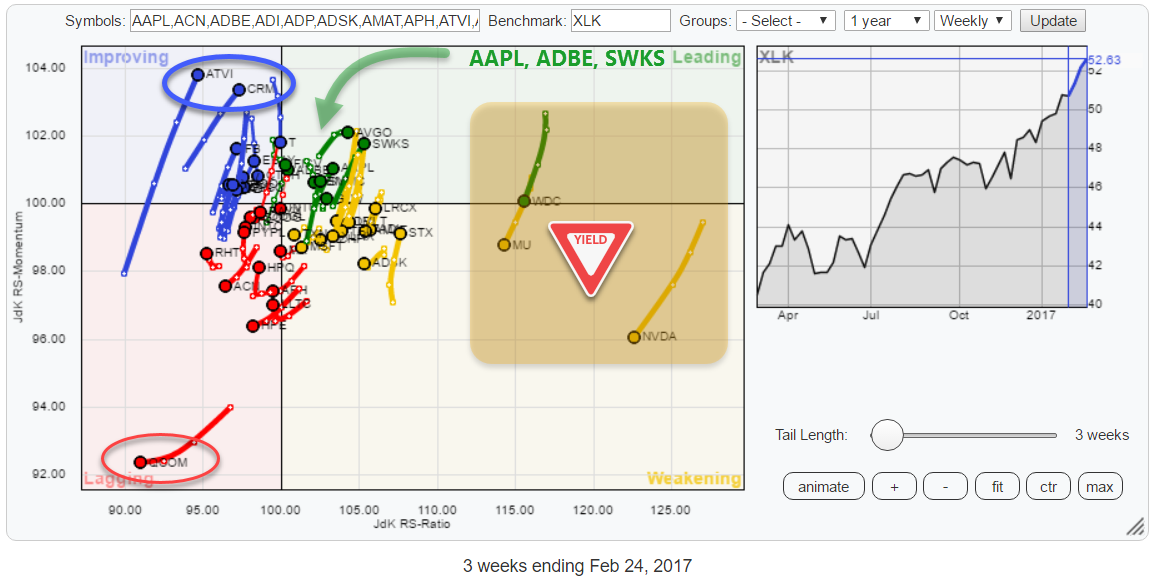
The Relative Rotation Graph above holds the members of the S&P 500 Technology Index as included in the XLK sector ETF.
A few observations that can be made right from the start studying this graph. On the far right-hand side of the plot, we see three stocks, sharply, heading lower from the leading quadrant into the weakening quadrant. These are WDC, MU, and NVDA. Reading the RRG chart and looking at their position and rotational pattern we can immediately make the assumption that these three have been very strong stocks leading the sector but now losing pace.
Given their, very, high JdK RS-Ratio readings we can also assume that their relative trends have are, which means that their, relative, downside risk can be significant. Something you want to check out.
Another lone ranger, but this one inside the lagging quadrant, is QCOM. Not much relative power expected for that one in coming weeks.
In the top-left, improving quadrant, two names stand out. They are ATVI and CRM. Why? Because these are the two stocks with the highest relative momentum (JdK RS-Momentum) at the moment and nice long tails, especially ATVI, indicating that there is power behind the move.
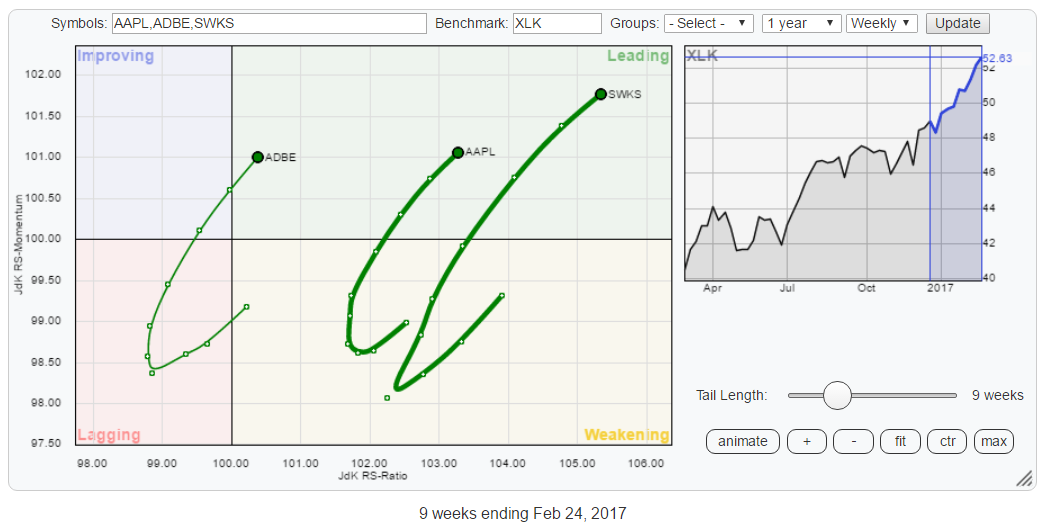
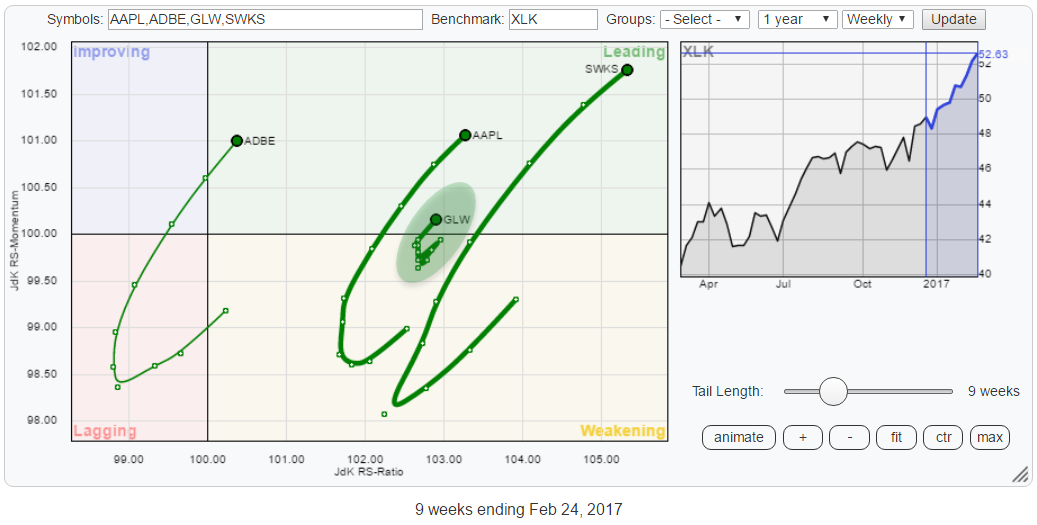
To get a better view of what's going on just to the top right of the benchmark we need to zoom in on that area. I have picked three stocks of which I think that they are worth a further investigation and put them on a zoomed in RRG below. These are ADBE, AAPL, and SWKS.
From a sector perspective
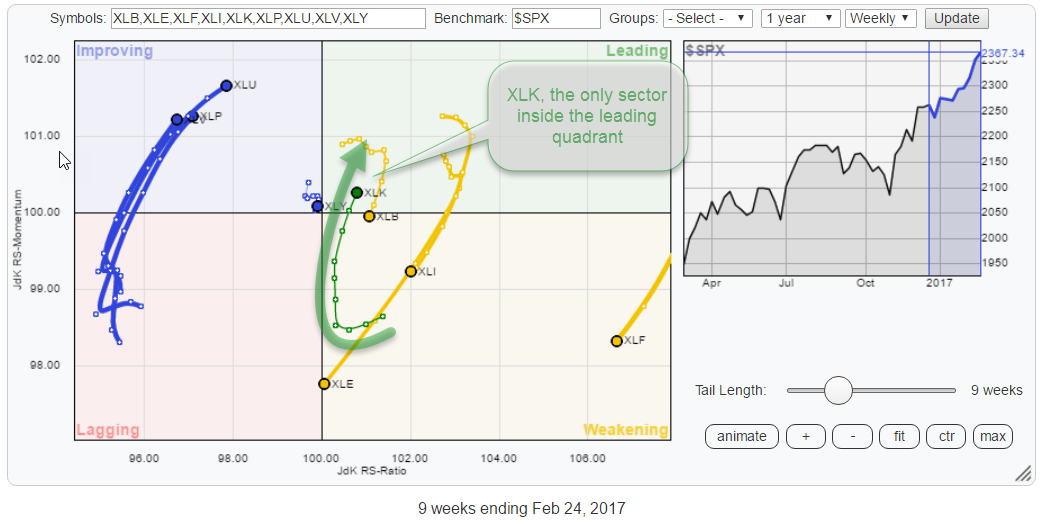 In this post, I want to dig a bit deeper into the rotational patterns of individual stocks against the sector index (XLK). To get a better perspective as to why this is an interesting exercise, we need to step back for a moment and take a look at the current state of sector rotation among the sectors against SPY.
The RRG above shows this picture, and what immediately stands out is the fact that there is only ONE sector inside the leading quadrant! And that is XLK, Information technology.
A second interesting observation is the similar rotational pattern of the three sectors inside the improving quadrant. XLU, XLP, and XLV are tracing out the almost same pattern.
XLE is very close to crossing over into the lagging quadrant, confirming its recent relative weakness. XLF, the Financials sector is still highest on the JdK RS-Ratio scale but weakening rapidly. For now, I prefer to avoid financials but will keep an eye on its heading turning back into the 0-90 degree area.
BYE BYE
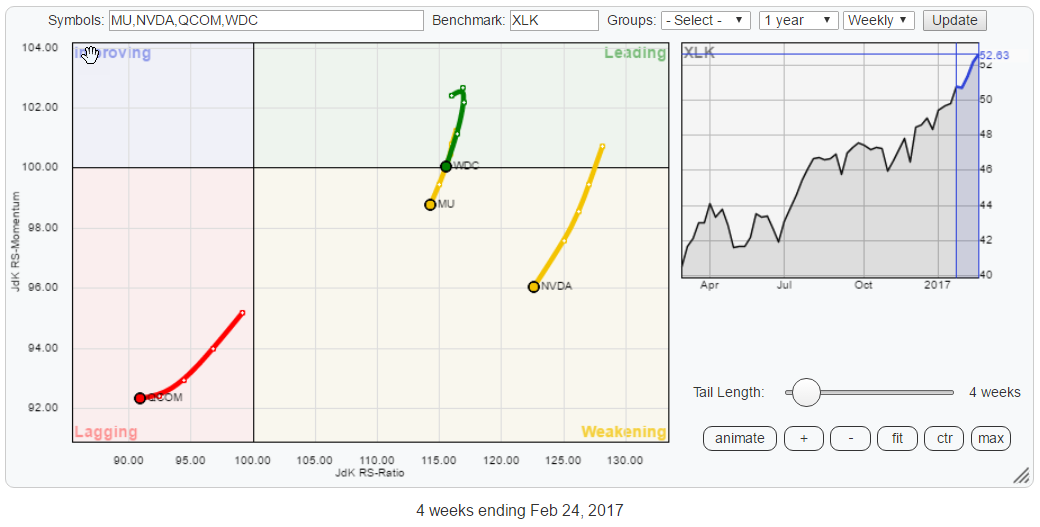 The strongest trends get the strongest corrections. With this in mind, the rotational pattern for NVDA urges caution. WDC and MU are similar but to a lesser extent. QCOM has already crossed over into lagging and confirmed its relative weakness.
Because of the clear downtrend in QCOM, I will focus on WDC, MU, and NVDA
NVIDIA Corp. - NVDA
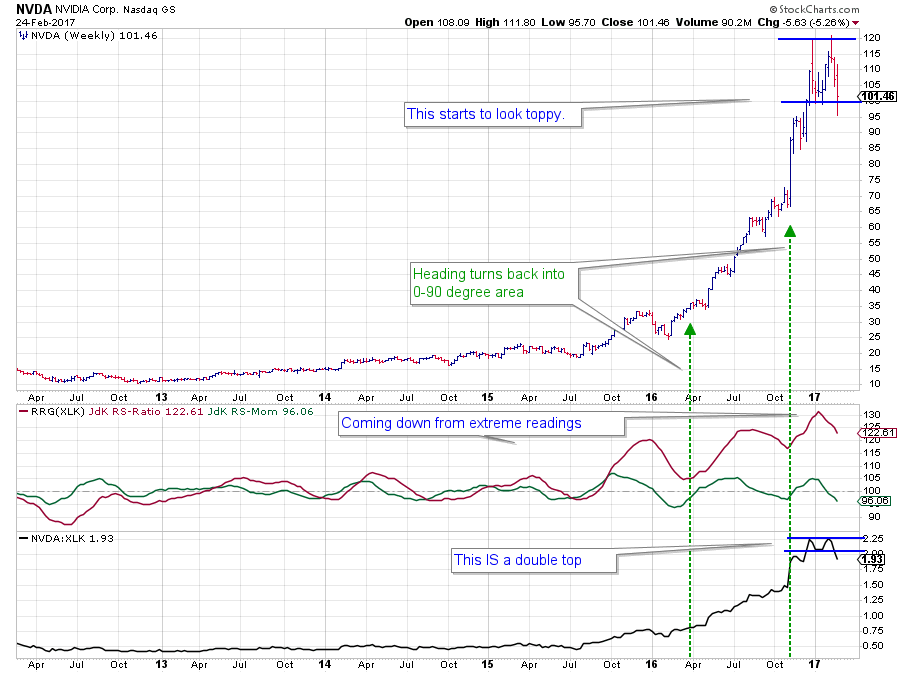 NVDA went through a more than magnificent move and more than quadrupled over the past two years.
From a relative point of view, the outperformance was picked up by the RRG-Lines in the middle of 2015 when JdK RS-Ratio crossed above the 100-mark and followed the up-move in the raw RS-Line.
As a side note; This chart provides an excellent example of the strength in case of a tail turning back to an RRG-Heading between 0-90 degrees while inside the weakening quadrant. The two green dashed vertical lines mark the points in time when that happens.
But, all good things come to an end and, at least for the time being, NVDA setting itself up for a bigger correction.
On the price chart, for the first time in a long period, NVDA has not been able to take out a previous high and continue its uptrend. Instead, after failing to break higher, the price dropped back to the level of the previous low at $ 100 and already briefly peeked below it.
A weekly close below $ 100 will complete a clean double top formation and trigger more decline in price.
The relative strength line seems to be leading at the moment as here the double top had already completed when RS broke below its previous low.
Given the very strong previous trend, the RRG-Lines, especially the RS-Ratio line has to come down from a very extreme reading which means that it will remain on the right-hand, positive, side of the RRG chart for quite some time. This is when RS-Momentum becomes your best friend.
When relative momentum continues to drop, eventually NVDA will be pushed over into the lagging quadrant. If, however, RS-Momentum manages to start turning back up while inside the weakening quadrant and drag the heading of the tail around and back into the 0-90 degree area you will get a good re-entry possibility.
For the time being the relative risk/reward is not in favor for maintaining long- or overweight positions in NVDA any longer.
Western Digital Corp. - WDC
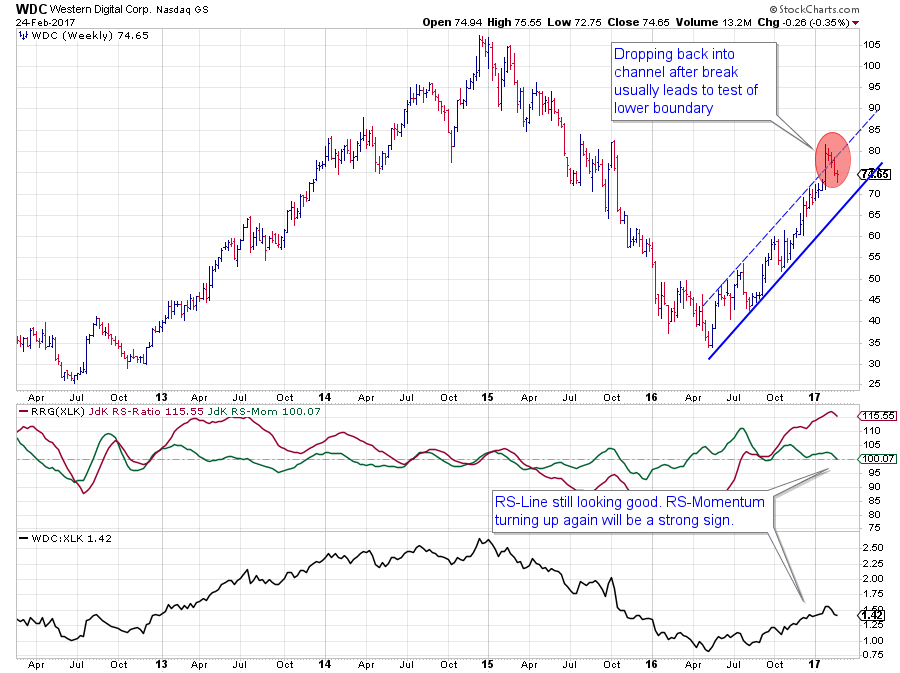 The rotational pattern for WDC is not as extreme as NVDA, yet!
The price chart shows a nice uptrend in a rising channel coming out of the May 2016 low. A few weeks ago the price managed to break above the already rising resistance line. However, the break did not last long, and WDC dropped back into its channel. Although not a turn-around, or trend-ending signal in itself, it usually leads to more weakness and often a test of the lower support boundary of that channel.
For WDC this means that there is some downside risk in price in coming weeks.
The trend in relative strength is still good but recently got affected by the drop in price which caused JdK RS-Momentum to turn down and push the stock towards the weakening quadrant on the Relative Rotation Graph.
Within this universe, RS-Ratio levels around 115 are pretty high. As said above, in these situations RS-Momentum becomes your best friend.
For now, and from a relative perspective, there is no reason to maintain an overweight or long position in WDC. Simply, because better alternatives are available in the sector. But, when relative momentum (JdK RS-Momentum) turns up, and the tail on WDC goes back to a 0-90 degree RRG-Heading, new opportunities may become available.
Micron Technology Inc.- MU
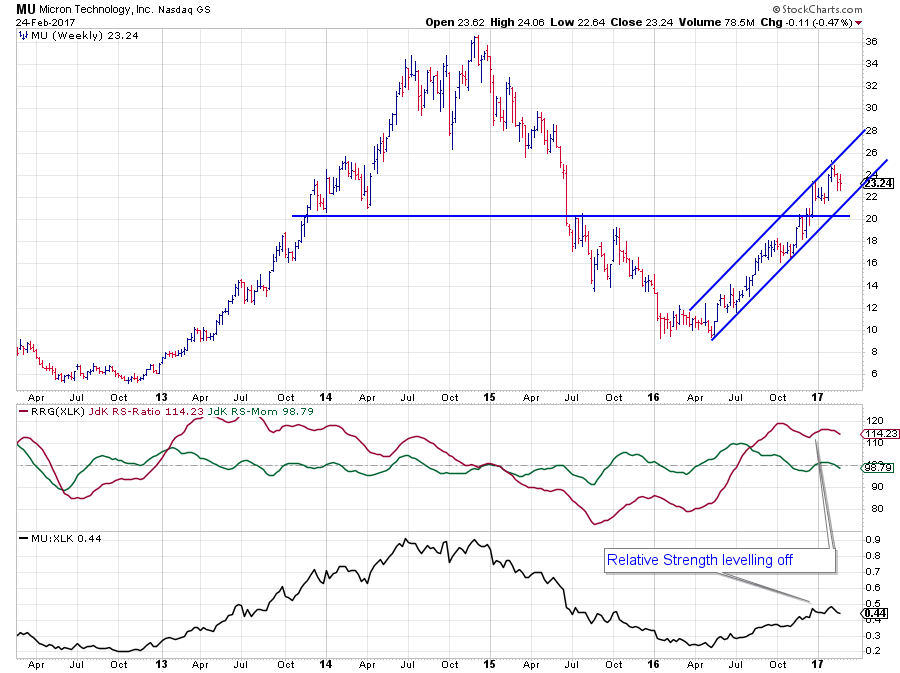 The chart of MU comes closest to the one of WDC above.
The uptrend in price is clearly visible, although no upside breakout here, and MU just touched the upper boundary of the channel and started a correction.
MU already went through a rotation on the right-hand side of the graph. Leading-Weakening-Leading just before the transitioning from 2016 to 2017. At the moment RS-Momentum is declining again and has just pushed below 100 which puts MU inside the weakening quadrant again.
Just like NVDA and WDC, it is "Bye Bye" MU for the time being at risk for a further, relative, decline is increasing.
Hellooooo
 The good thing about relative strength analysis, in particular in a closed universe, is that opposite of members that are underperforming the benchmark there are also members in the same universe that are or are starting to outperform the benchmark.
In the case of the Technology sector, I have identified three stocks that are moving opposite of the prior three above, ADBE, AAPL, and SWKS. And I have added in one chart, GLW, as a bonus to show what a very stable relative trend looks like on its price chart and the Relative Rotation Graph.
Corning Inc. - GLW
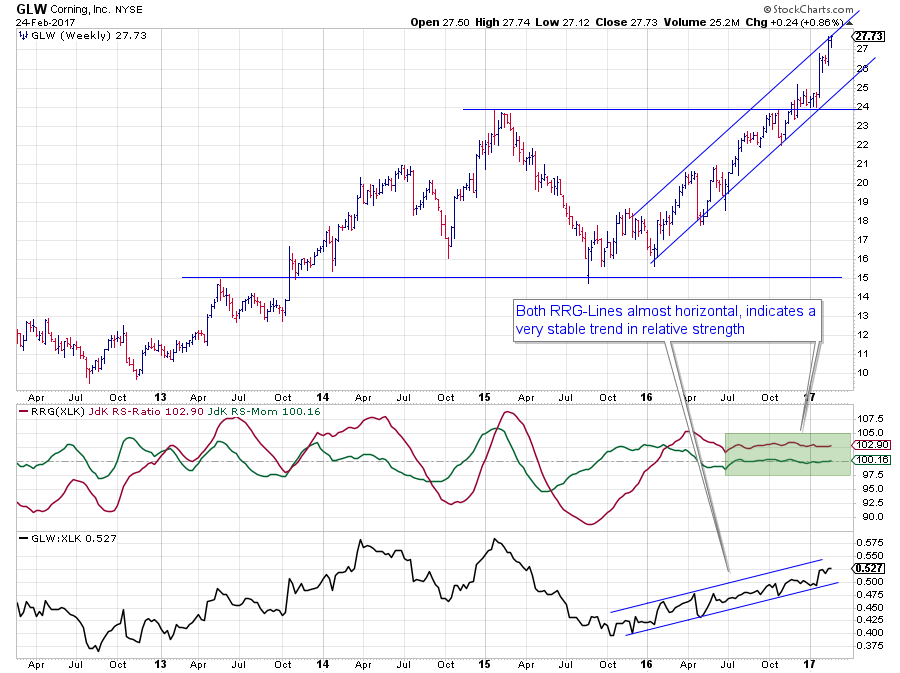 Let's start with the bonus stock. Corning is moving in a rising channel on both the price and the relative charts since the beginning of 2016.
What caught my eye is the horizontal moves for both the JdK RS-Ratio line and the JdK RS-Momentum line since July 2016.
Both are moving more or less flat with little oscillation and as you can see that translates, or better it is the result of, a very steady uptrend in price and relative strength.
On the RRG this results in a position to the right of the benchmark, indicating an uptrend. And a very short tail that stays close to the 100-mark on the JdK RS-Momentum axis.
Short tails, close to the benchmark, indicate stable trends and this is a prime example.
Adobe Systems, Inc. - ADBE
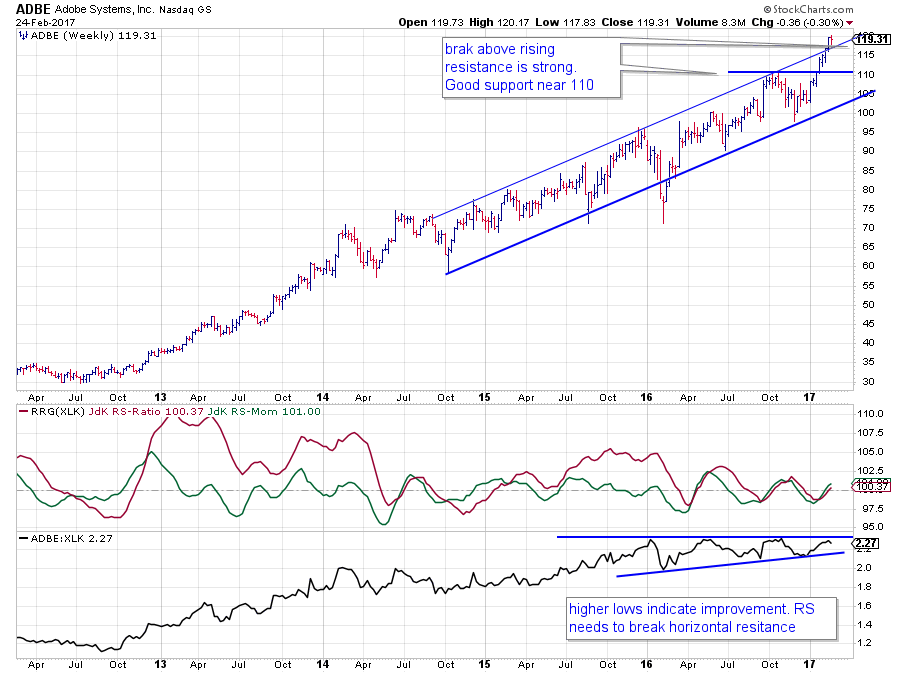 The price chart of ADBE shows the stock in a nice uptrend, channel, since late 2014. And recently confirming its strength by breaking overhead resistance near $ 110 as well as breaking its rising resistance line last week. A drop back into the channel would trigger some more price decline, but good support is expected around the level of the prior peak around $ 110.
A more interesting situation is panning out in the relative charts. Over the past year, the raw RS-Line has set three peaks around the same level. All lows over the same period have come in at subsequently higher levels. This indicates a gradual improvement of relative strength as investors have been willing to pick up ADBE stock at relatively higher levels.
These high-low rotations are also visible in the RRG-Lines where the oscillation around the 100-level are getting narrower and narrower.
Recently ADBE is showing strength again and has traveled through all four quadrants and rotated back into the leading quadrant. Especially a break of raw RS above its horizontal resistance level is expected to give further relative strength a boost and push ADBE further into the leading quadrant.
Apple, Inc. - AAPL
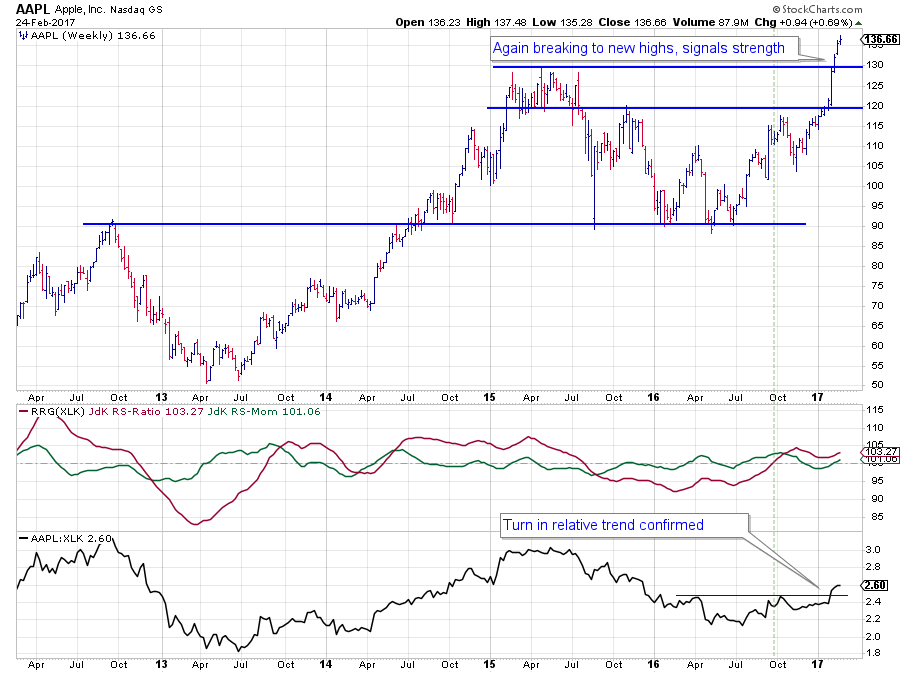 Although it is hard to believe there has been a period, more than a year actually, where stock market love-baby APPLE underperformed the technology index (XLK). From June/July 2015 to July/August 2016, the raw Relative Strength of AAPL against XLK declined.
This situation started to change towards the end of 2016, and the turn in trend was recently confirmed when the RS-Line crossed above its recent peak.
The change in trend was already picked up by RS-Ratio when it crossed above 100 in October last year, pushing AAPL into the leading quadrant. After a short rotation through weakening AAPL recently rotated back into the leading quadrant ( also see prior blog post covering rotation of $INDU stocks )
With Relative Strength now above its resistance level and the tail heading in 0-90 degrees area, more outperformance is likely for AAPL in coming weeks.
Skyworks Solutions, Inc. - SWKS
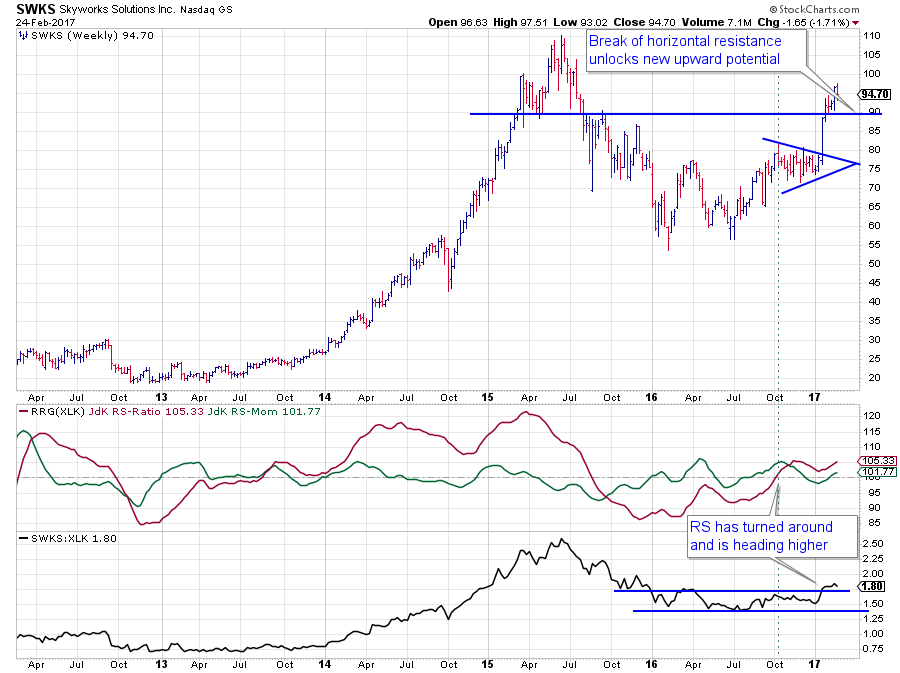
The third name that is picking up relative strength is SKWS.
On the relative charts, the RS-Ratio line picked up a new uptrend in relative strength back in October when it crossed above 100, pushing SWKS into the leading quadrant. At that time raw RS was still captured inside a trading range.
In the last quarter of 2016, a symmetrical triangle formed on the price chart and a positive signal was triggered on the strong break out of this formation early 2017. Rapidly after this first break, SWKS also managed to break beyond the horizontal barrier around $ 90, which is now acting as support.
A few weeks ago, the RS-Line broke out of its trading range providing new fuel to the relative rally and turning the tail of SWKS back up again and into the leading quadrant with force. At the moment SWKS has the longest (=strongest) tail of all three stocks mentioned.
With upward potential on the price chart now unlocked towards $ 110 and relative strength on the move, further strength is expected in the period ahead.
Julius de Kempenaer | RRG Research
RRG, Relative Rotation Graphs, JdK RS-Ratio and JdK RS-Momentum, are registered TradeMarks by RRG Research
Follow RRG Research on social media:
