RRG Charts April 29, 2017 at 08:17 AM
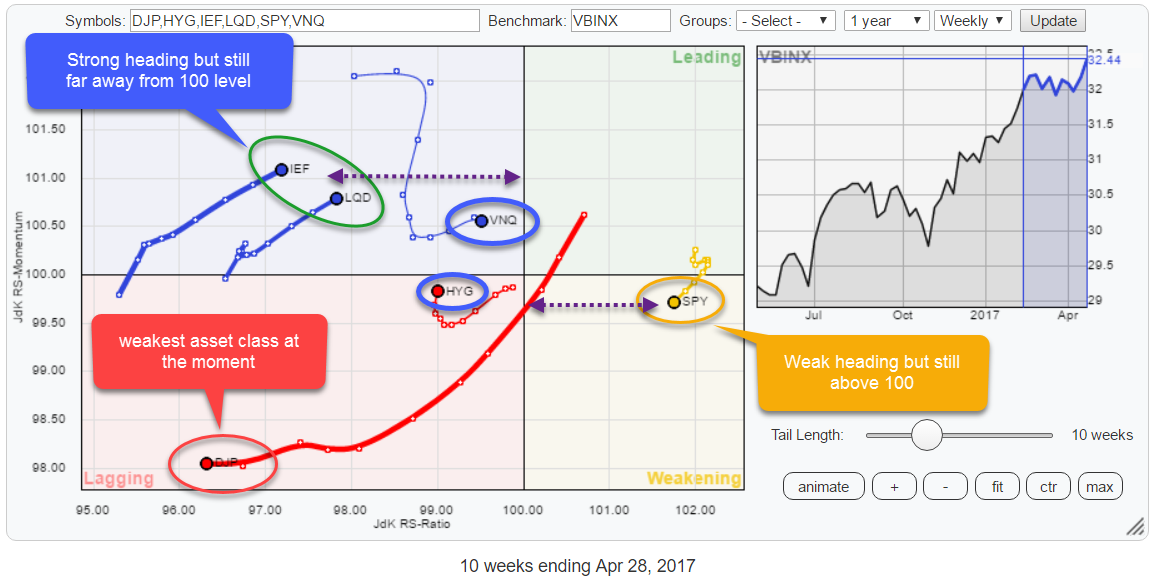
The Relative Rotation Graph for asset classes shows that not a single category is inside the leading quadrant at the moment and only one asset class, equities (SPY), is on the right-hand side of the plot... Read More
RRG Charts April 19, 2017 at 03:22 AM
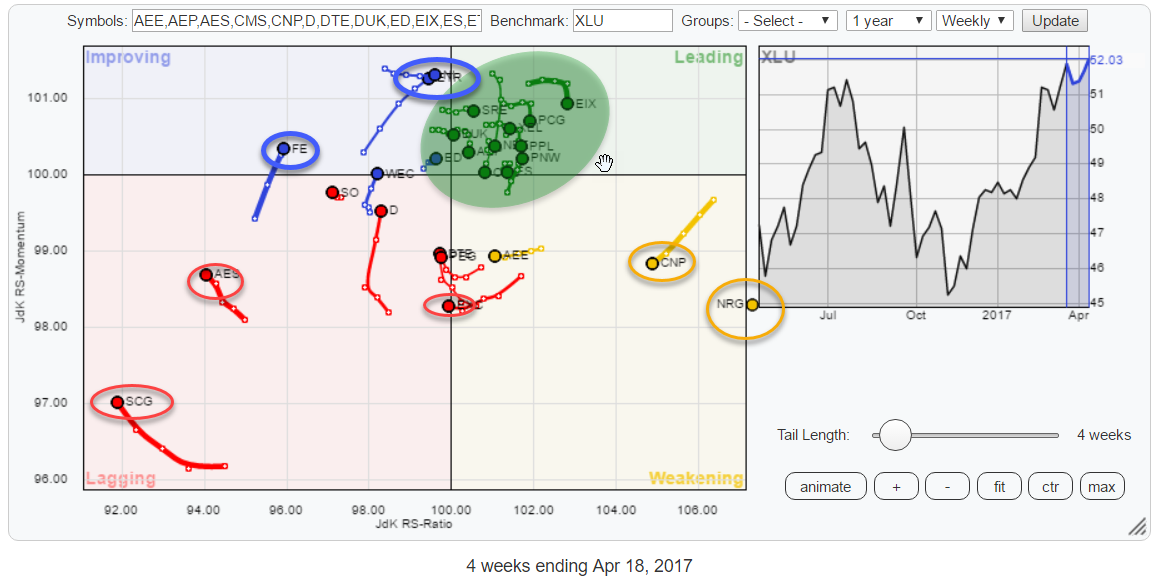
The Relative Rotation Graph above holds the stocks that, together, make up the Utilities sector index (XLU). The keen observer may notice that there is one stock, NRG, positioned in the "gutter" of the chart... Read More
RRG Charts April 09, 2017 at 12:48 PM
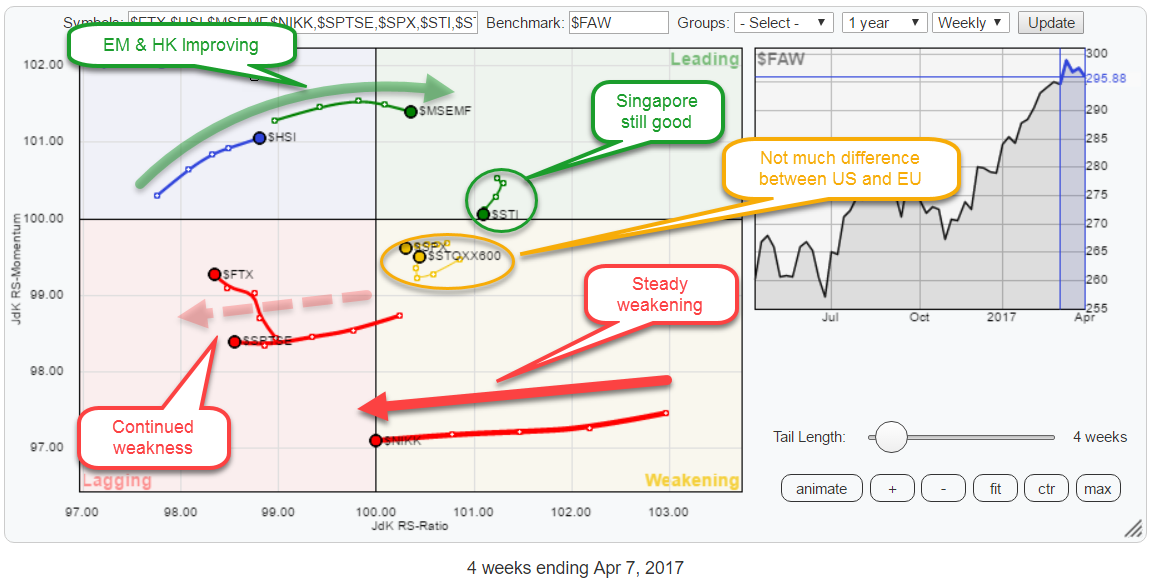
The Relative Rotation Graph above holds some the major world market indices and compares them to the FTSE all world index ($FAW) as the benchmark. Straight from the RRG above we can make a few interesting observations... Read More