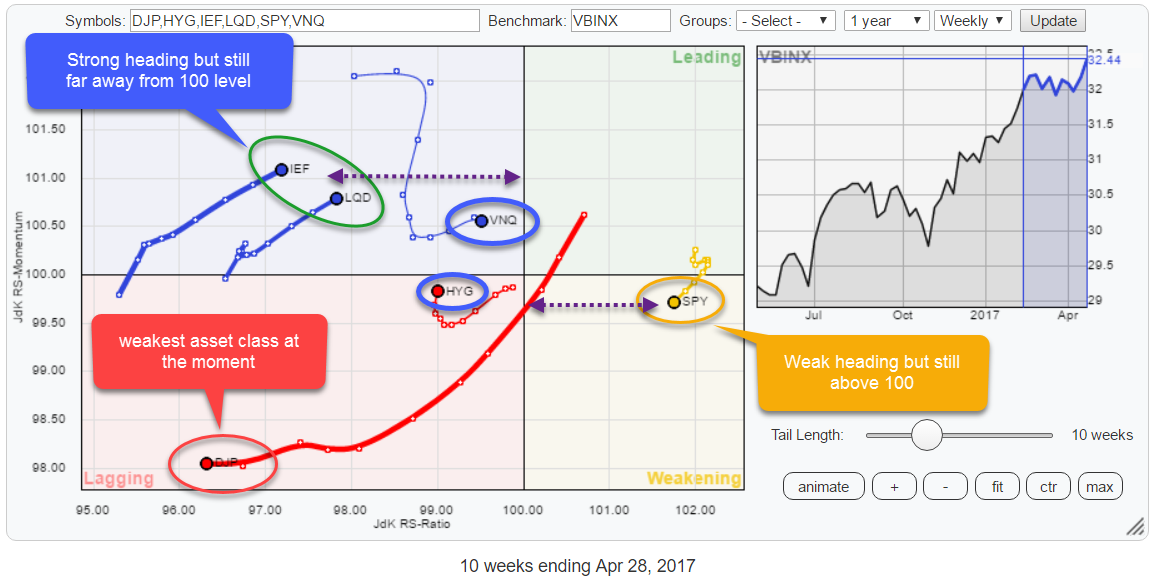
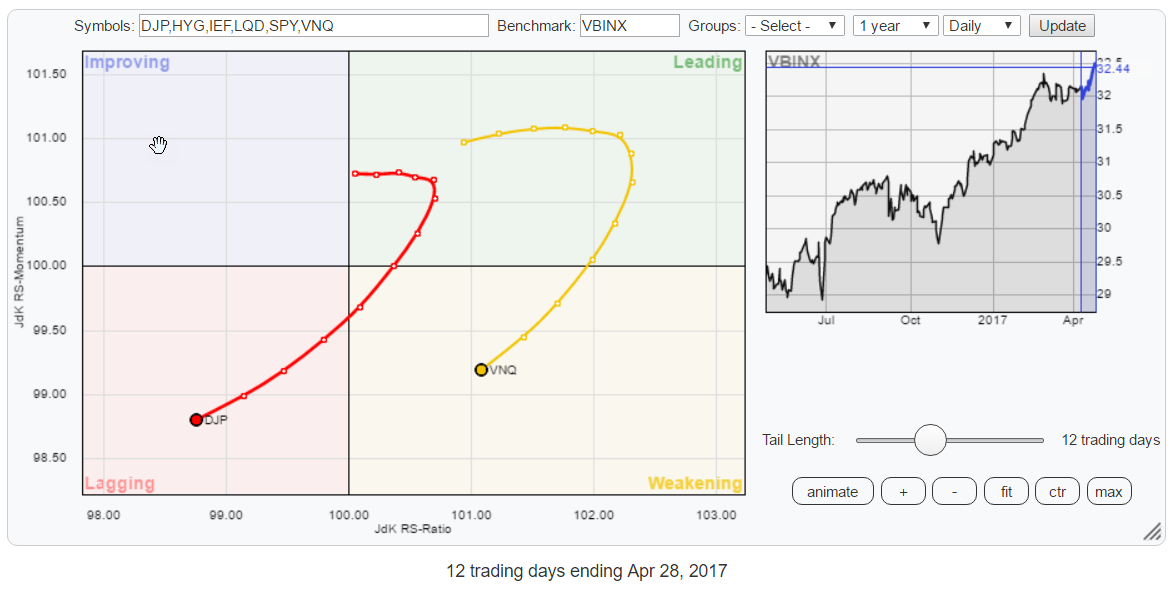
 The Relative Rotation Graph for asset classes shows that not a single category is inside the leading quadrant at the moment and only one asset class, equities (SPY), is on the right-hand side of the plot.
The quick take from this reading is that only SPY, asset class equities, is in a relative uptrend against VBINX but losing momentum, hence positioned inside the weakening quadrant. The good news is that the distance from its current position to the 100-level on the Jdk RS-Ratio axis is still big enough to possible turn back up into the leading quadrant without crossing over into lagging.
A somewhat similar rotational pattern is seen inside the improving quadrant for IEF, Government bonds, and LQD, Corporate bonds. They are still in relative downtrends against VBINX but have been picking up some relative momentum lately. However, they are still well below the 100-level on the RS-ratio scale which means that there is still the risk for a rotation back towards the lagging quadrant, without hitting leading.
The two asset classes that stand out on this RRG are Commodities which are showing a very long tail while pushing deeper into the lagging quadrant. And Real-Estate which rotated towards the leading quadrant on a positive heading but last week seems to stall in its attempt to continue its improvement.
Summary
- Equities in weakening quadrant but only asset class on right-hand side of RRG
- Government bonds expected to rotate back down to lagging quadrant
- Current rotation calls for equities to remain preferred asset class
- Commodities weakest and relative strength expected to push further down in coming weeks
- Cautious approach towards Real Estate (VNQ) despite recent move towards leading quadrant
Equities - SPY
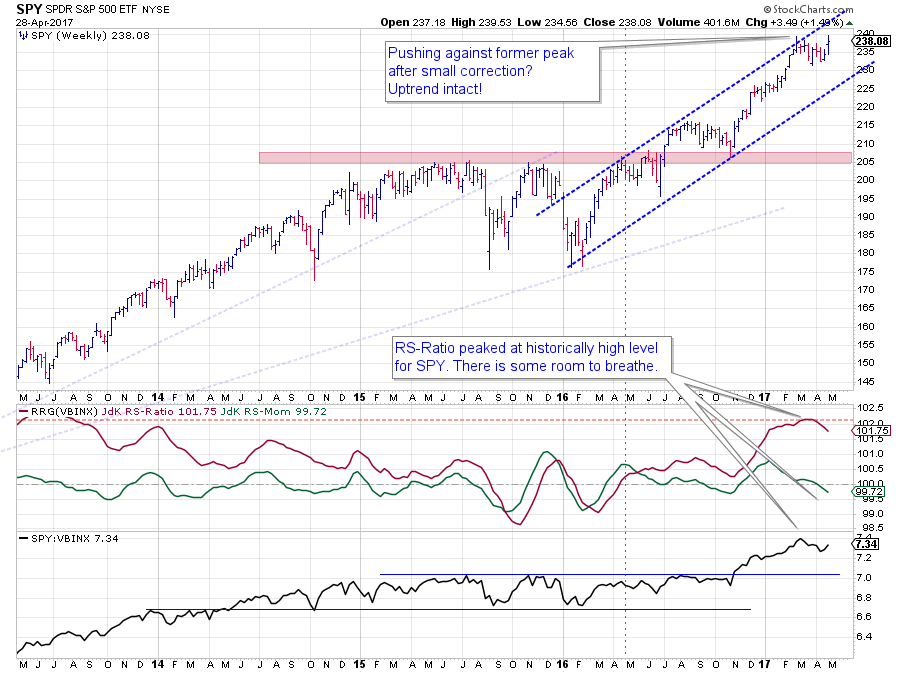 The price chart of SPY is still doing very well and working its way higher within the boundaries of a rising channel. The recent high against the upper boundary of the channel released a lot of commentaries calling the end of the current trend.
After a few weeks of sideways or slightly downward movement, the recent rally can very well signal the end of the "correction" and send SPY higher again. A push beyond the recent high near 240 would be a good indication that SPY is prepared to move even higher.
As you can see on the Relative Rotation Graph above, Equities (SPY) is the only asset class that is positioned on the right-hand side of the graph. Albeit in the weakening quadrant.
This position indicates that the relative uptrend of SPY against VBINX is still intact but has lost some relative momentum over the past few weeks. This is not difficult to understand when you look at the RRG-Lines in combination with the RS-Line below the price chart.
The corrective move off of the upper boundary of the rising channel has taken its toll on the RS-Line as well. But, as RS-Ratio was/is at historically high readings there is plenty of room for SPY to go through a relative correction without ending up in a relative downtrend.
On the Relative Rotation Graph, this translates into a position INside the weakening quadrant but still far to the right with a decent distance to the 100-level on the RS-ratio axis offering enough room to complete a rotation on the right-hand side of the RRG and turn back into the leading quadrant.
Government bonds - IEF
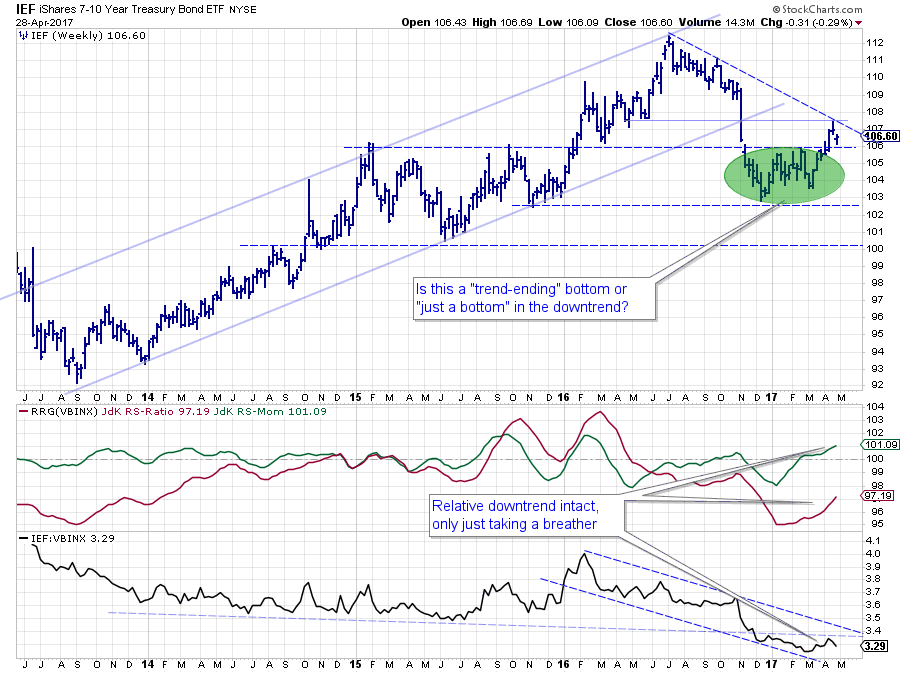
The Government bond chart shows a very clear relative picture, and it is pointing lower. Meaning a relative downtrend for Government bonds versus VBINX. Over the past few weeks, there has been an improvement that pushed the JdK RS-Momentum line above 100 which started dragging RS-Ratio higher from very low levels.
But, will the move be strong enough to pull RS-Ratio all the way up to 100. Or in other words, will the recent improvement in relative momentum be strong enough to turn the current relative downtrend around?
In this sort of situations, I like to inspect the raw RS-Line itself to get a better handle on the rotation. In this case, the RS-Line is sending a pretty clear message. The downtrend that started from the high that was set in early 2016 is still intact, but what is more important, the RS-Line just recently tested the former support level (light blue dashed line) as resistance and started to head lower off of this, now, resistance level.
Based on the distance from the 100-level the odds are for a rotation inside the improving quadrant back towards the lagging quadrant. Opposite to the rotational pattern for SPY inside the weakening quadrant.
The price chart for IEF is showing a bit of a mixed pattern. The big uptrend over the past years was clearly broken in Q4 of 2016, leading to a drop in price towards 103, where support was found. The formation that formed since late 2016 could be seen as a, completed, double bottom which suggests that a new uptrend has started. 106 was the trigger level for completion of the double bottom and should now start to act as support for declines. Which it seems to be doing.
The problem is that a falling support line coming off the 2016 peak is coming into play again and was recently tested around 107.50. Price action in coming weeks will very likely hold the clue for longer-term developments in IEF. Breaking back below 106 will render the double bottom as "just a low" within the falling trend and trigger further weakness for Government Bonds.
Daily RRG for SPY and IEF
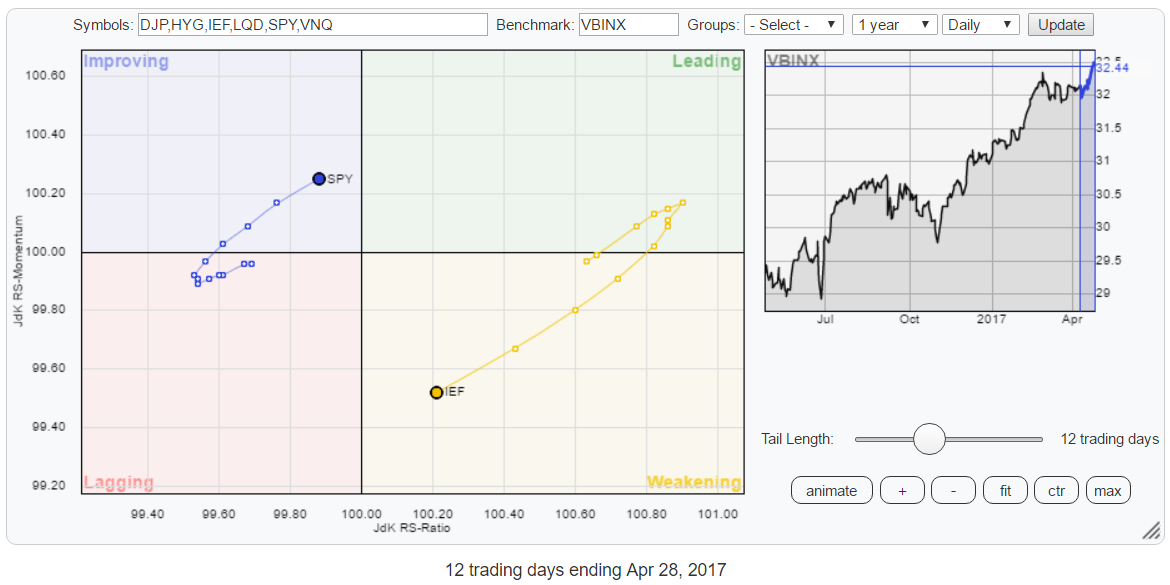
Running a daily RRG for SPY and IEF shows that the rotational pattern on this shorter time frame is already showing improvement for SPY and weakness for IEF backing the analysis above for the weekly rotations to complete on either side of the RRG.
But What If....?
I can hear you think; But, "What if....."; IEF does break higher, takes out the falling resistance line, and starts to work its way higher again.
Honestly...?: I don't know... It will blow up the current rotational picture, and we'll have to re-asses the then newly emerging situation. It's too early to tell, and we'll have to wait and see if the market will throw us a curve-ball.
For the time being it looks like equities remain the preferred asset class.
Commodities - DJP
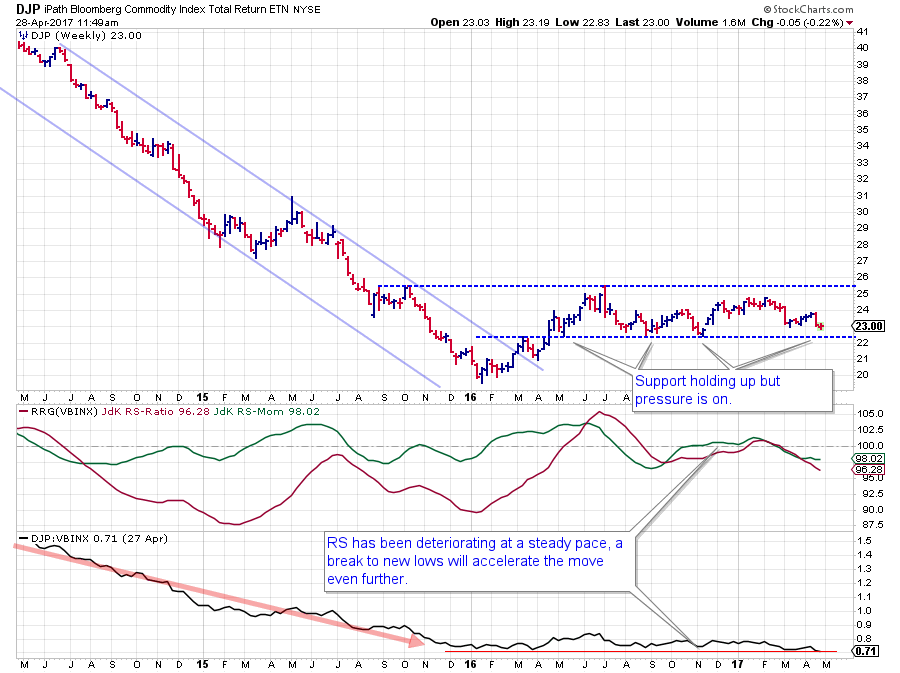
The Relative Rotation Graph sends a very clear message for commodities. Within this universe, DJP is clearly the weakest asset class and is showing no signs of improvement anytime soon. As a matter of fact, the rotational picture on the daily RRG has just started to confirm the weakness on the weekly RRG suggesting that another relative down move is around the corner.
On the price chart, DJP is caught within the boundaries of a trading range between $ 22.50 - $ 25.50 and on its way for another test of the lower boundary. No doubt that a break below this support level will cause even more and accelerated weakness for commodities.
The RRG-Lines show a very steady decline, positioning DJP, deep, inside the lagging quadrant. The small sideways move of RS-Momentum on the weekly chart shows up as a positive rotation on the daily RRG. But on that same daily RRG, DJP has already powerfully moved back into the lagging quadrant, confirming the rotation that is visible on the weekly RRG.
All in all, commodities should better be avoided for the time being as it seems to be a falling knife, at least from a relative perspective.
Daily RRG for DJP and VNQ
Real-Estate - VNQ 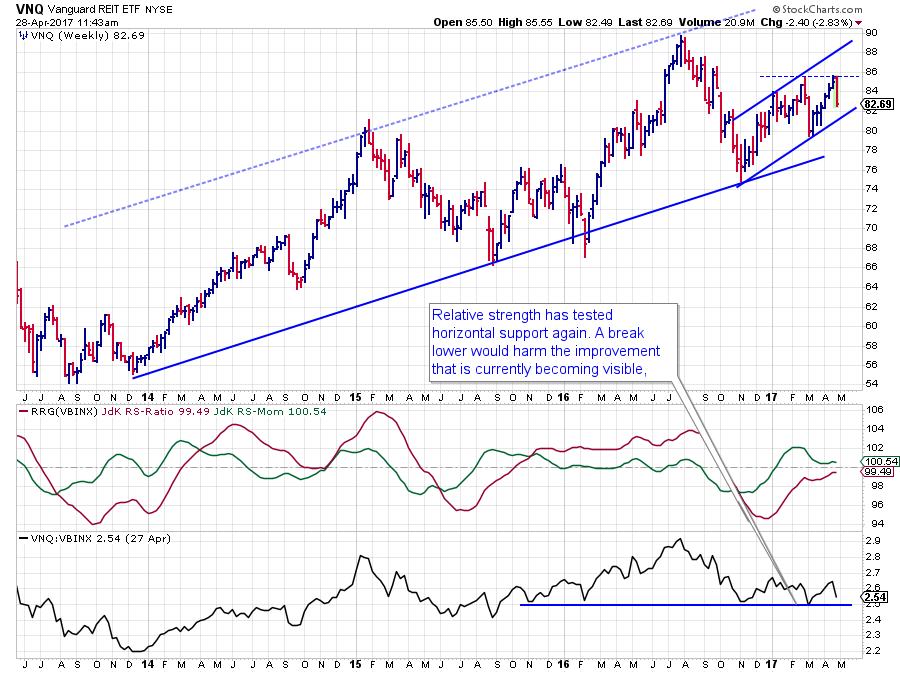
On the daily RRG above, I have also included VNQ (Real-Estate) as it shows a more detailed view of the recent price action in VNQ last week.
Reading from the weekly RRG at the top of this article, VNQ seemed to head towards the leading quadrant since its hook back up three weeks ago. Last week this improvement, all of a sudden stopped causing VNQ to remain almost at the exact same location on the weekly RRG. The very short distance between the last and the previous observation on the weekly RRG takes away all the power from the rotation.
The cause of this sudden halt is found in the price action near the ~$ 86 resistance level coming from the recent high. VNQ turned sharply lower from this resistance level dragging relative strength down with it. The raw RS-Line is now nearing an important horizontal support level, and a break lower will very likely cause an acceleration. This is already starting to reflect in the RRG-Lines where RS-Momentum is moving flat after a small decline and RS-Ratio, as a result, seems to start a topping process below the 100-level.
It's all very close to benchmark levels, which makes it a bit of a close call but based on the fact that the power of the momentum disappeared and VNQ is already heading towards the lagging quadrant on the daily RRG I'd like to maintain a very cautious stance towards real estate in a portfolio.
Julius de Kempenaer | RRG Research
RRG, Relative Rotation Graphs, JdK RS-Ratio, and JdK RS-Momentum are registered TradeMarks by RRG Research
Follow RRG Research on social media:
If you want to discuss RRG with me on SCAN, please use my handle <Julius_RRG> so I will get a notification
