RRG Charts July 30, 2017 at 07:32 AM
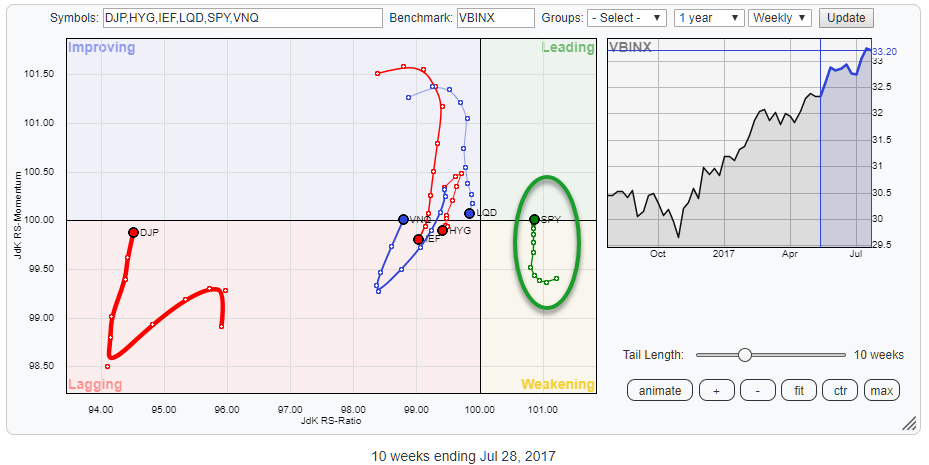
The above Relative Rotation Graph holds some ETFs representing various asset classes and compares the against VBINX, a balanced index fund that holds 60% equities and 40% bonds... Read More
RRG Charts July 20, 2017 at 09:30 AM
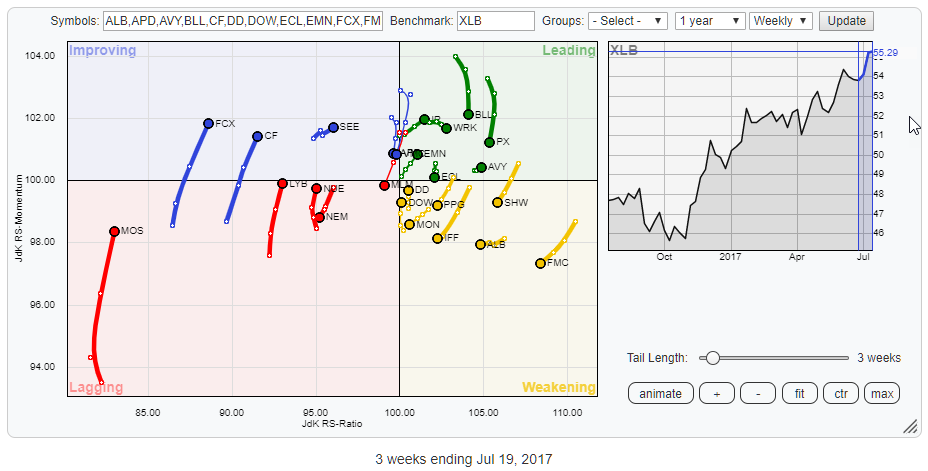
The Relative Rotation Graph above holds the constituents of the Materials sector (XLB)... Read More
RRG Charts July 06, 2017 at 04:46 AM
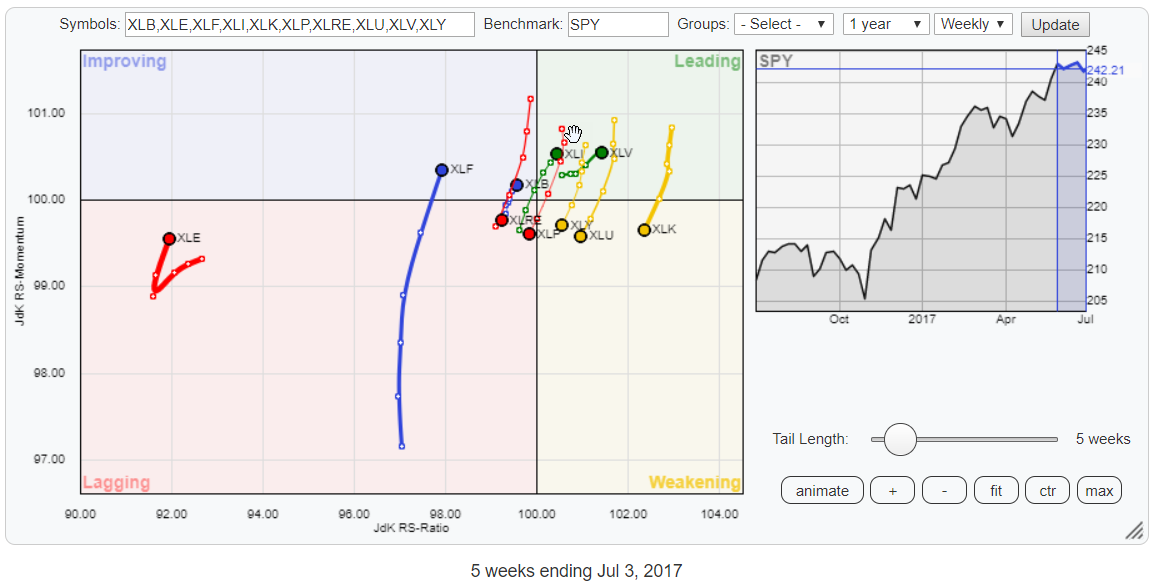
The almost vertical tails on the above Relative Rotation Graph for US sectors indicates a very clear (relative) momentum rotation, sending some sectors from North to South and vice versa... Read More