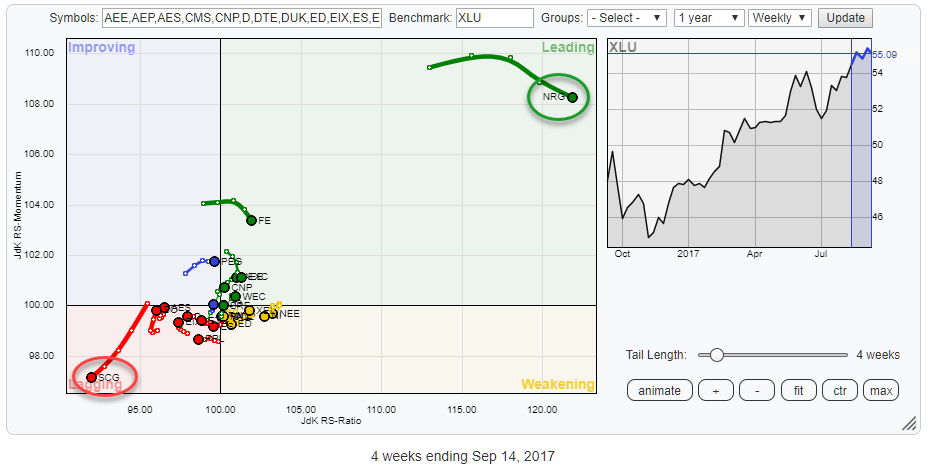
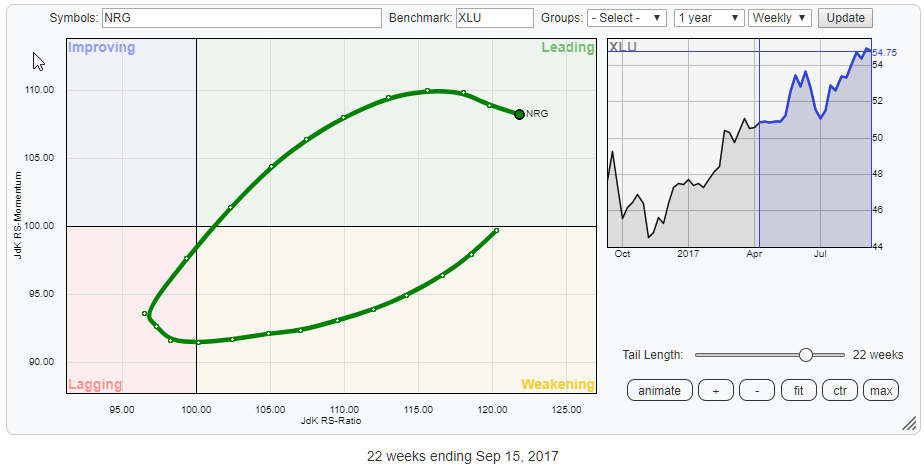
 Bringing up the Relative Rotation Graph that holds all members of the Utilities sector (XLU) gives the picture above. With NRG all the way up in the top-right corner of the leading quadrant and SCG in the lower left-hand corner of the lagging quadrant, the remaining stocks in the sector are getting a bit squeezed around the center of the RRG.
It means that we definitely have to inspect those two stocks on the outside of the universe a bit closer and then zoom in on the stocks around the benchmark to find out what is going on there.
Utilities are often characterized as a "boring" sector, but as you can see on the RRG, there's a lot going on under the hood, and given the position and rotational pattern of XLU on the sector RRG against SPY it is a sector to watch closely at the moment.
Summary
- Utility sector moving back into leading quadrant from weakening
- NRG and SCG pushing to opposite edges of the RRG
- CNP entering the leading quadrant at a good pace.
- AEE comfortable inside leading quadrant and pushing higher
- ED failing to break resistance and losing relative strength
- ES breaks relative uptrend against XLU and moves deeper into lagging quadrant
At sector level
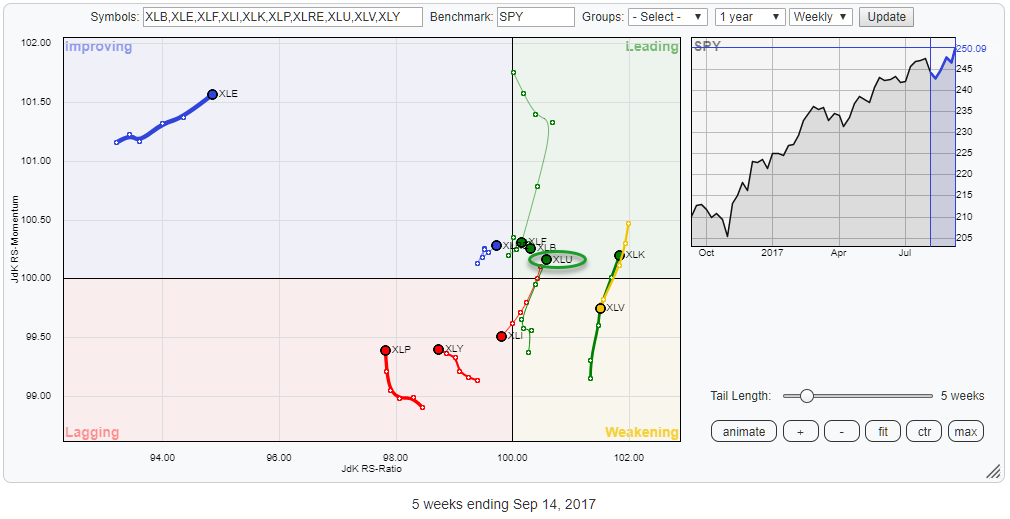
The Relative Rotation Graph for US sectors shows the Utilities sector (XLU ETF) just entering the leading quadrant again from weakening after a downward rotation through weakening since late June.
Looking back over the past ten years for similar rotations (Leading-Weakening-Leading) across all sectors in the S&P 500 we have found 62 occasions. The average return in the 12 weeks after rotating back into the leading quadrant, from weakening, was around 3.5% (2.4% relative vs. SPY) with 66% of the occurrences being profitable.
Reason enough to keep an eye on this particular rotational pattern.
Stock rotation inside XLU
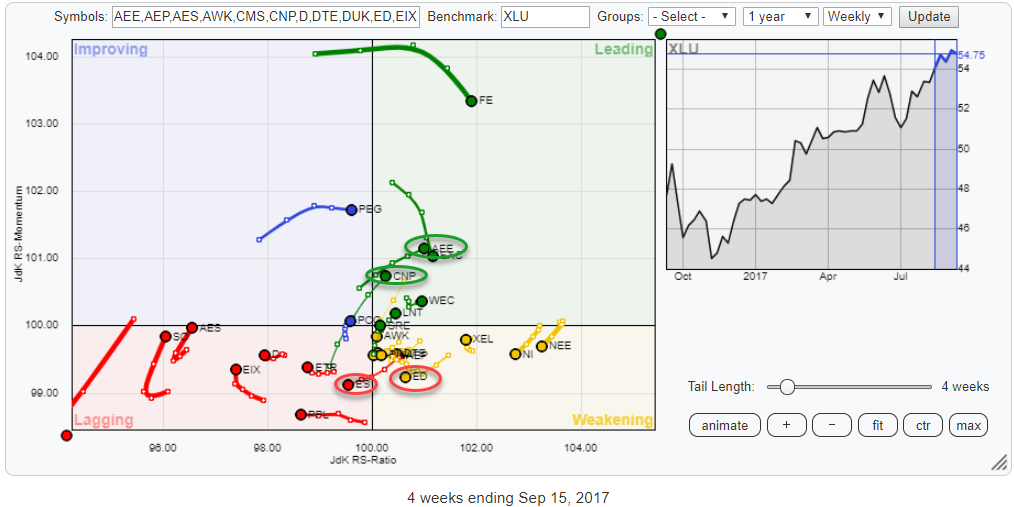
Zooming in on the RRG that holds all members of the Utilities sector reveals the current rotations in more detail. Looking at the various positions of individual stocks and their RRG-heading and tail lengths there are four stocks I want to inspect further.
These are CNP and AEE inside the leading quadrant, ED inside weakening and ES inside lagging.
CNP and AEE have just entered the leading quadrant from improving and continue to gain on both axes. As they both have just crossed over, there should be enough relative upside left for them to continue their relative uptrend against XLU.
Inside the weakening quadrant, ED stands out for its long(er) tail and proximity to 100 on the RS-Ratio scale and as it is the stock at the lowest RS-Momentum reading inside that quadrant.
ES is the latest stock to enter the lagging quadrant while heading lower on both scales and with a relatively long tail suggesting strength in the (down)move.
On the edges of the universe
NRG Energy Inc. - NRG
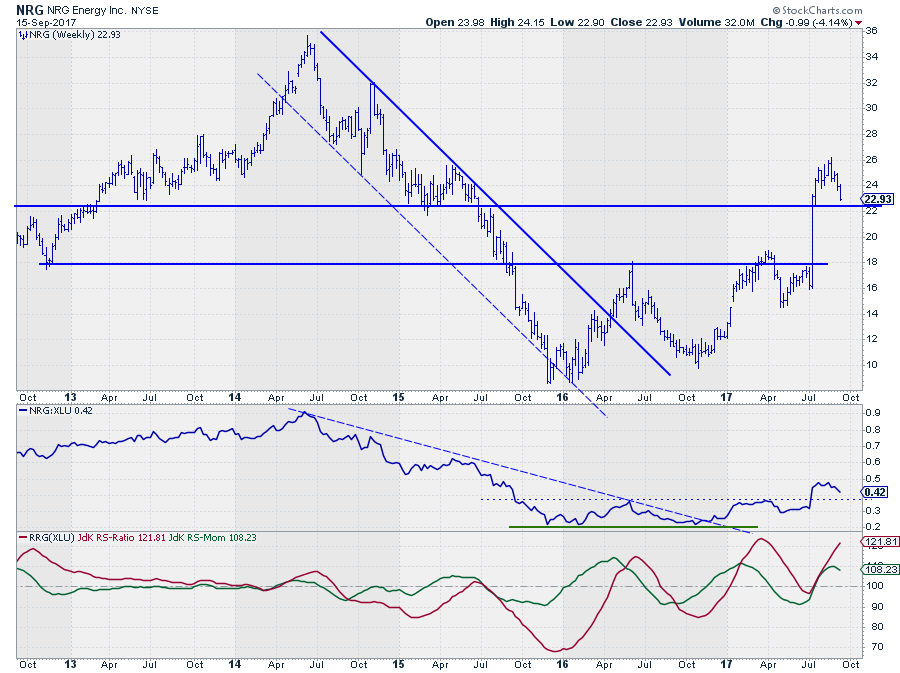
NRG Energy started this year very strong with a rally towards the $ 18 - $ 19 area on the price chart where it met resistance coming off a 201 low and the 2016 peak. After a brief peek above that resistance level, NRG dropped back below this level for a corrective move down to $ 14 where a significantly higher low was formed.
The Relative Strength line traced out a similar pattern with a rally up to the relative peak level of 2016 and then set a higher low in RS as well.
The RRG lines pushed above 100, positioning NRG inside the leading quadrant already in the first month of 2017. The drop above in relative strength since April caused JdK RS-Momentum to roll over and push below 100 and this stretch of weakness was followed by a brief dip of JdK RS-Ratio below 100 as well.
The RRG chart below, holding only NRG against SPY shows the brief rotation of NRG through lagging and then into leading without touching the improving quadrant a very unusual, but very strong, situation.
Scana Corp. - SCG
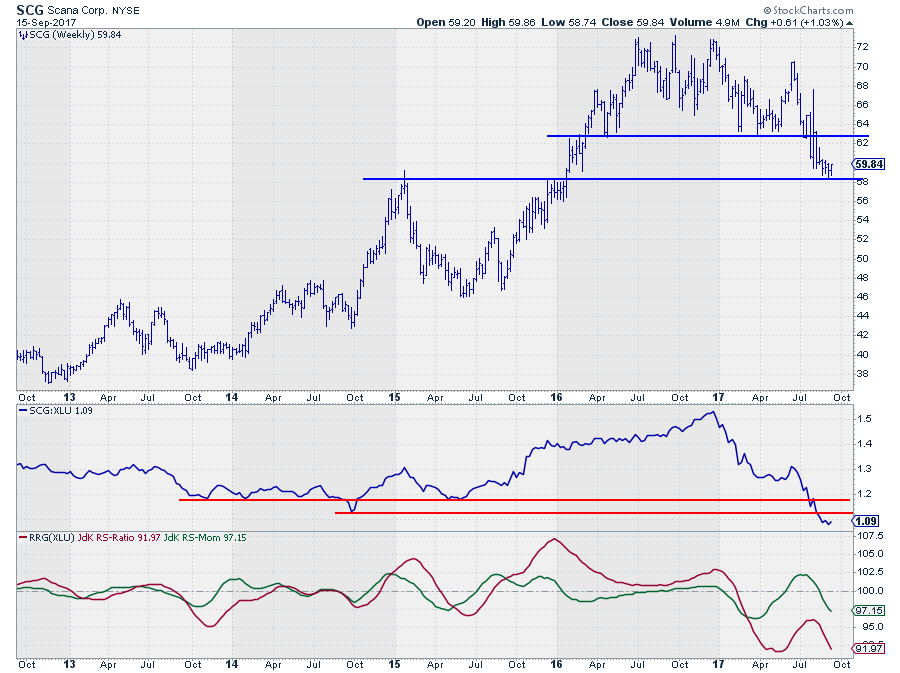
Tucked away, deep down in the lower left-hand corner of the Relative Rotation Graph continues to send signals of weakness. The chart above underscores that position.
On the price chart, Scana Corp. broke below a horizontal support level just above $ 62 a few weeks ago and rapidly dropped further to the next support level around $ 58 which is being tested as we speak.
The relative strength chart looks even worse. After setting a high towards the end of 2016, relative strength for SCG against SPY started to drop rapidly and has been moving steadily lower apart from a small recovery during the summer.
Over the past few weeks, two horizontal support levels offered by old lows were broken very easily. The RS-Ratio line moved below 100 at the beginning of this year. The RS-Momentum line returned above 100 for a short while, but that recovery only pulled RS-Ratio back towards the 95 area, which is still very low, before dropping back below 100 and providing new fuel to the relative downtrend. This interaction caused a perfect rotation on the left-hand side of the RRG as can be seen below.
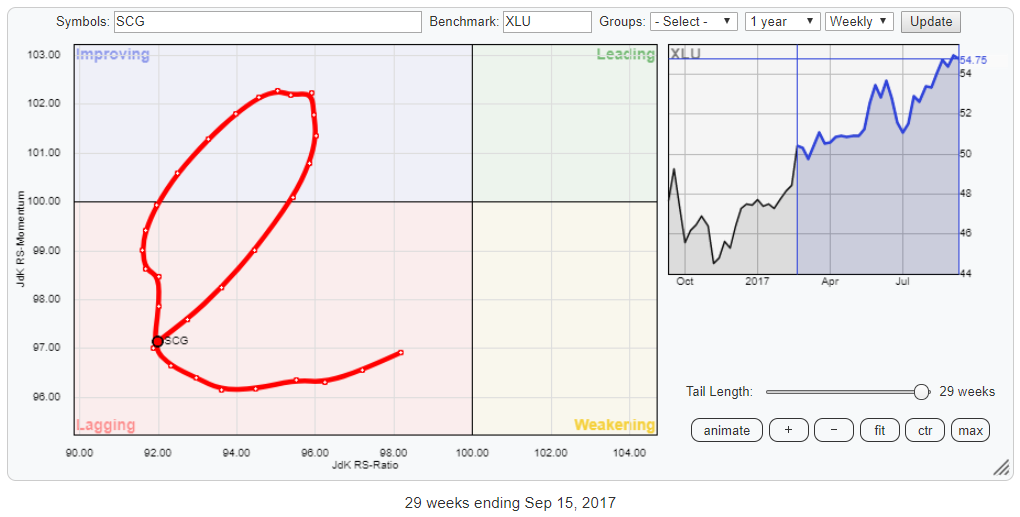
At the moment SCG continues to head lower on both axes with no signs of an improvement at short notice.
Entering the Leading quadrant
CenterPoint Energy Inc. - CNP
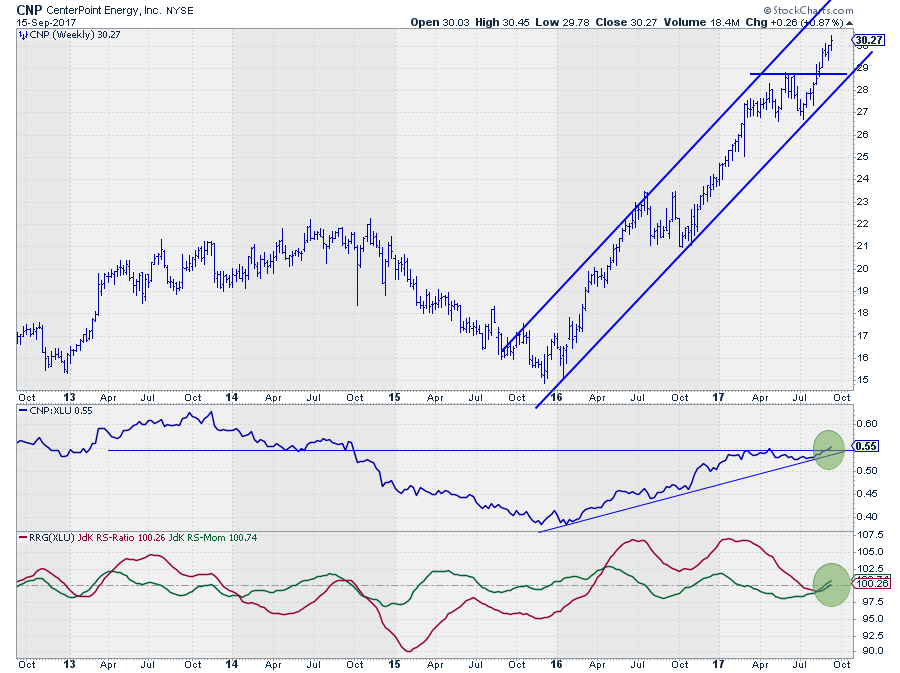
CenterPoint Energy just confirmed its strong uptrend by breaking above its previous peak and continuing higher within the boundaries of the rising channel. That old resistance level around $ 28.75 - $ 29.00 will now serve as support in case of a corrective move down.
The RRG-Lines picked up the relative uptrend against XLU in March/April 2016, and they tracked the RS-Line higher with one complete rotation at the right-hand side of the RRG and recently a very brief rotation through the lagging quadrant before returning to the leading quadrant again.
Both the break above horizontal resistance in the RS-line and the cross above 100 in both RRG-Lines are in their very early stages which seems to provide a good opportunity to board the move with (re)new(ed) long or overweight positions
Ameren Corp - AEE
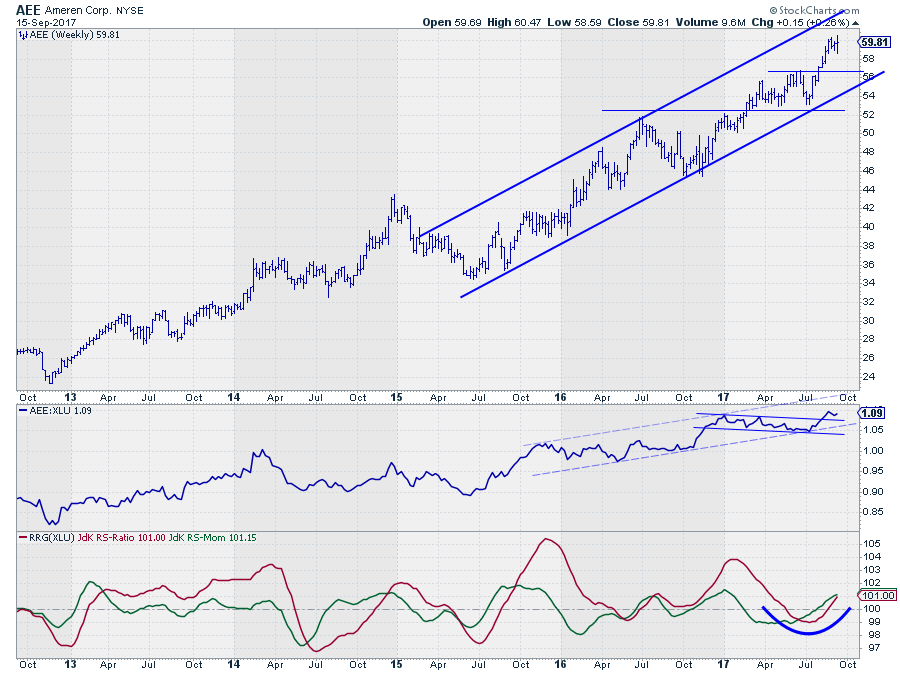
Ameren is the second stock that has just moved over into the leading quadrant from improving.
On the price chart, the rising channel is fully intact and the recent break above previous peak resistance around $ 56 confirmed the strong upward move.
On the RS-chart AEE clearly broke above its previous peak (horizontal resistance), bringing it comfortably inside the rising channel again. Also, both RRG-Lines are well above the 100-level, positioning AEE well inside the leading quadrant with still plenty of upward relative potential on the table.
AEE is ahead of CNP in its relative trend, but both stocks still seem to have plenty of potential upside left.
Weakening
Consolidated Edison Inc. - ED
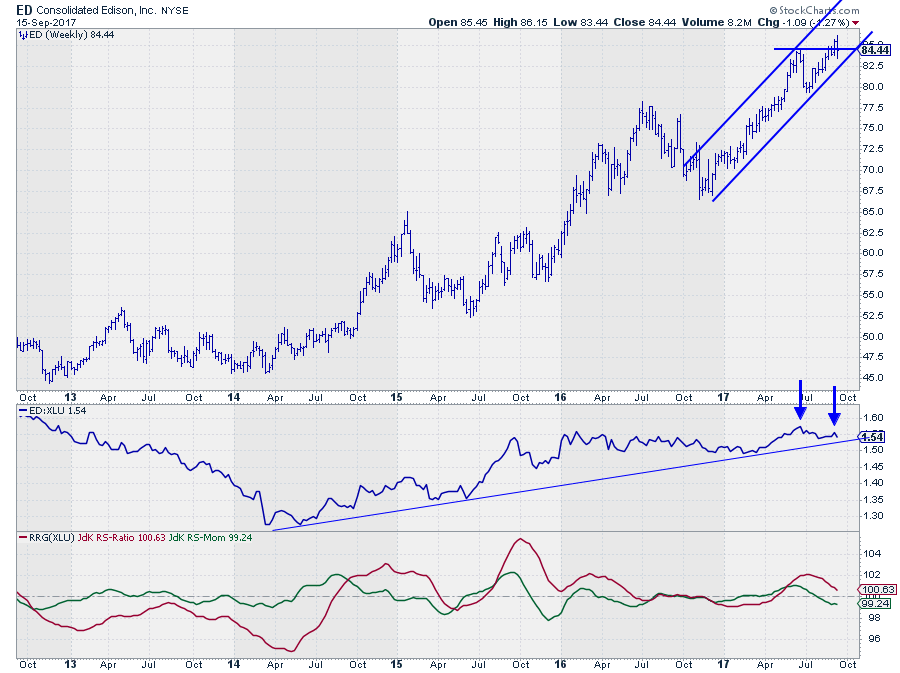
Consolidated Edison is still inside the weakening quadrant but heading towards lagging.
Inside the weakening quadrant, ED is the stock with the lowest JdK RS-Momentum reading or, in other words, the strongest negative relative momentum.
On the price chart, ED is testing overhead resistance around $ 85, closed above that level last week and back below last Friday. By no means a convincing break. Dropping back below $ 82.50 will break the rising channel and be a negative from a price perspective.
The RS-Line against XLU is hovering above its rising support line but seems to be forming a first lower high while, on the bigger picture RS has not been able to push beyond longer term horizontal resistance. The RS-Momentum line has already rolled over and crossed below 100, and RS-Ratio is heading lower as well and seems poised to cross over as well, putting ED into the lagging quadrant.
Lagging
Eversource Energy - ES
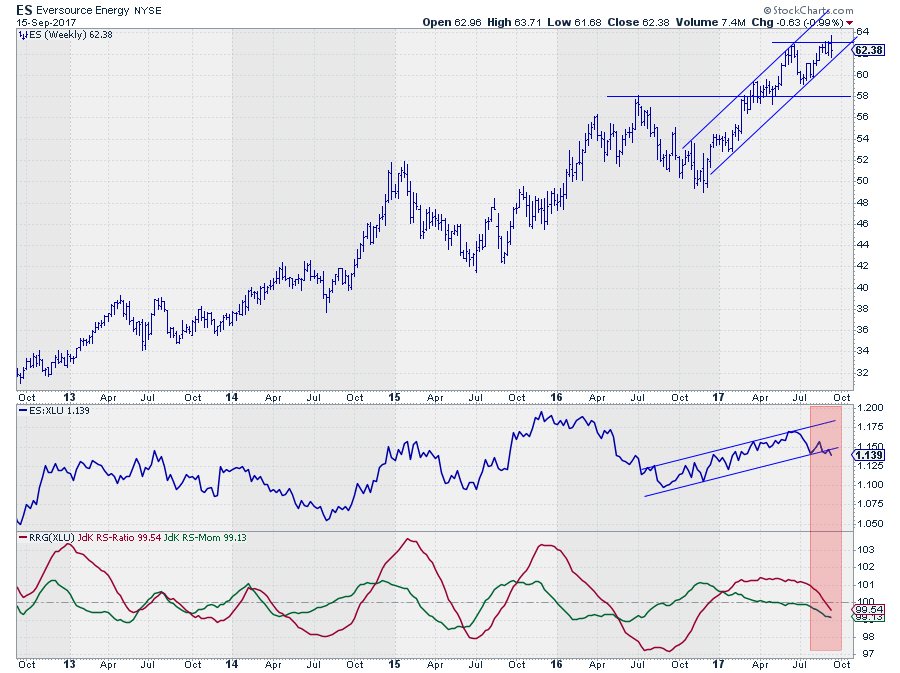
Eversource Energy is already inside the lagging quadrant and continues to drop on both axes.
On the price chart, ES is, just like ED above, testing overhead resistance offered by the previous high in the trend. Breaking the rising trend line will send a negative signal from a price perspective.
After weeks of flat movement with the JdK RS-Momentum line almost at 100 and JdK RS-Ratio moving horizontally around 101, RS-Momentum started to drop below 100 first (as usual) and was later followed by the RS-Ratio line below 100 pushing ES into the lagging quadrant.
The Relative Strength line has now also broken its rising support line confirming the weak outlook for ES.
If you like to receive a notification anytime a new article is posted in this RRG blog please leave your email address and press the green "Notify Me!" button below this article.
Julius de Kempenaer | RRG Research
RRG, Relative Rotation Graphs, JdK RS-Ratio, and JdK RS-Momentum are registered TradeMarks by RRG Research
Follow RRG Research on social media:
If you want to discuss RRG with me on SCAN, please use my handle Julius_RRG so that I will get a notification
