 In this blog, I will take another look at the 30 stocks that make up the DJ Industrials index.
A quick look learns that the real outsider in this index is GE which is positioned far to the left on the RRG, moving higher (almost vertical) on the JdK RS-Momentum axis but barely gaining on the JdK RS-Ratio scale.
Inside the lagging quadrant PG, MCD and CVX are showing weakness with tails pointing in a heading between 180-270 degrees.
The opposite is happening for BA and CSCO inside the leading quadrant.
For a better analysis of this universe, I have created a clip that toggles through all the members of the universe and shows highlighted tails with short comments in closed captions and then picked a few charts for further inspection following the analysis on the Relative Rotation Graph.
I am very curious to learn what you think of this type of hybrid video/blog combination and if you feel it adds value and gives better insight over only written content.
Summary
- Although inside the improving quadrant, GE remains a weak outsider
- BA and CSCO rotating at strong RRG-heading inside leading quadrant
- PG, MCD, and CVX expected to weaken further with tails pointing at heading between 180-270
- INTC rotating back up to leading while inside weakening quadrant, CAT potentially following the same pattern.
All 30 Dow stocks in less than 2 minutes
The clip above shows you the highlighted rotations for all 30 stocks in the DJ Industrials index. Most will have a short comment in the closed captions, some will have none as there is not much to report about them.
Weak and getting weaker inside the lagging quadrant
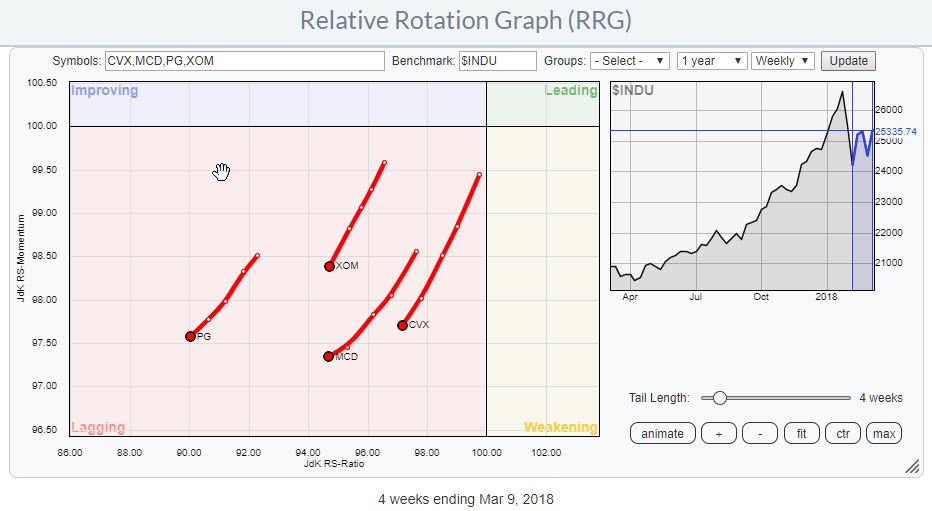
Inside the lagging quadrant, four stocks pop up with a tail at an RRG-Heading between 180-270 (South-West). These are PG, XOM, MCD, and CVX. The RRG above zooms in on these four stocks,
Procter & Gamble Co. - PG
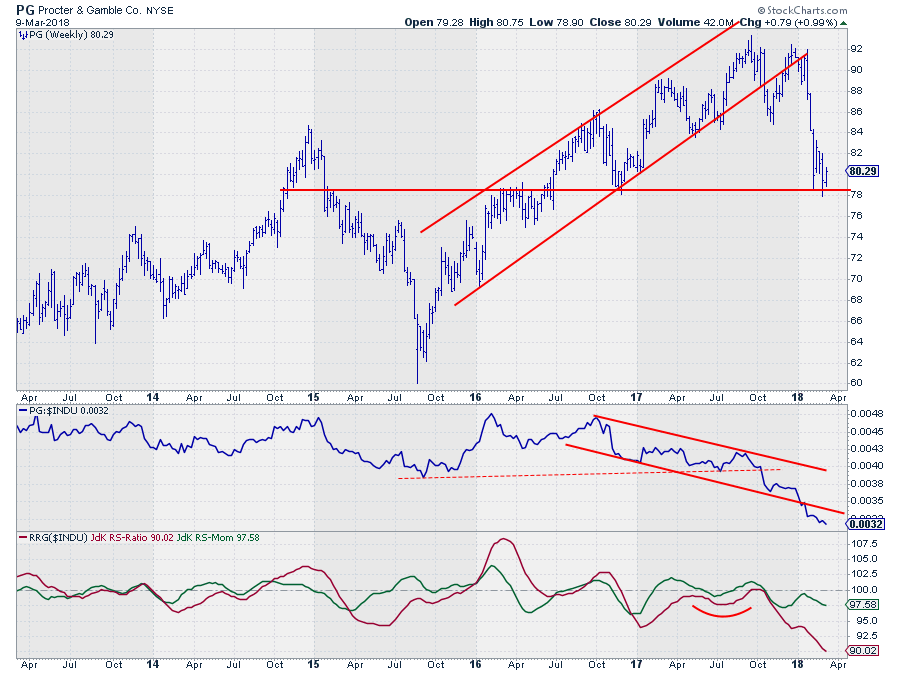
PG struggled with the rising support line towards the end of 2017 but eventually had to capitulate after a double top at $ 92 was completed early this year. At the moment the stock price is resting at support around $ 78 but a break lower, potentially after a small bounce towards resistance near $ 84 will very likely trigger more downside price action.
The relative line already broke below the falling support line, triggering an acceleration in the decline, which makes PG a stock to avoid.
Exxon Mobil Corp. - XOM
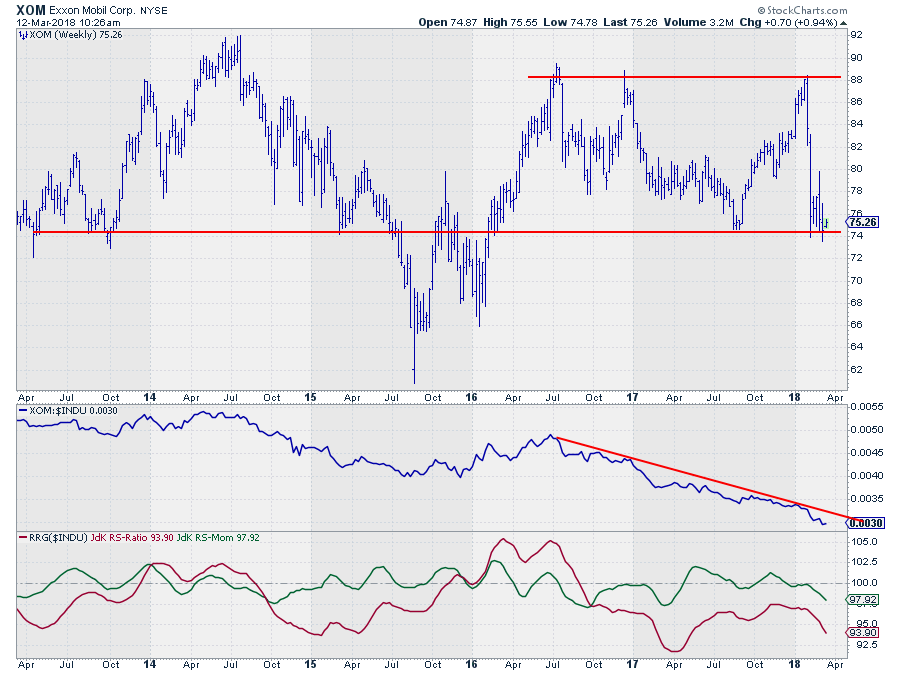
The RS line of XOM against $INDU is still in a solid downtrend. After a short rotation through improving XOM rotated back into the lagging quadrant (both RRG-Lines heading lower below the 100-level.
From a price perspective, the stock is at support now near $ 74. A break of this level will be the catalyst for a new decline possibly targeting the $ 66 area.
McDonalds Corp. - MCD
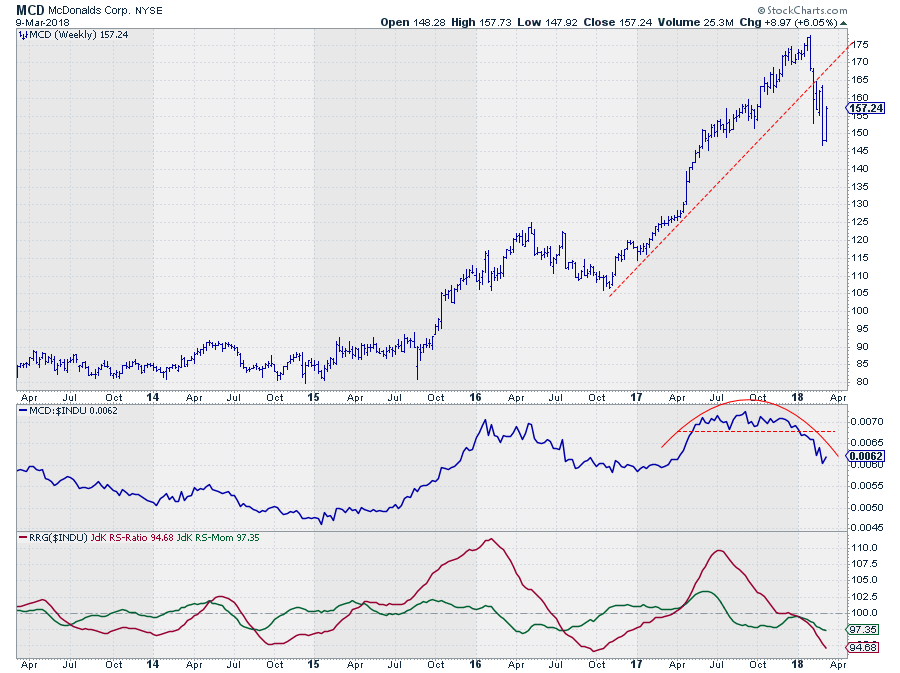 The decline off the high that was set early 2018 has seriously damaged the price chart of MCD. After violating the rising support line and taking out some previous lows the uptrend that started late 2016 is now broken. Any rally is now seen as a recovery rally which will very likely end up in setting a new (first) lower high.
The upside for MCD is now limited while downside risk is increasing.
The relative strength line gradually rolled over and started a new downtrend which is picked up by the RRG-Lines that are now both dropping while already below 100. This puts MCD well inside the lagging quadrant and moving deeper into it.
Chevron Corp. - CVX
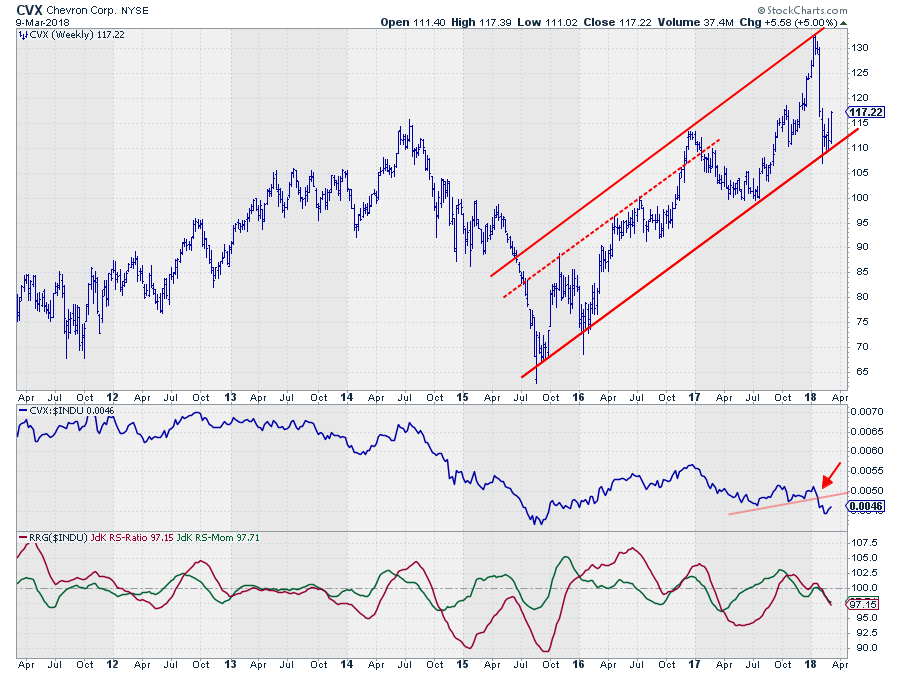
CVX is resting at support from the rising support line that connects the major lows since 2015 and just bounced higher off that level. This is encouraging price behavior which conflicts with the relative picture.
The RS-Line just broke a short-term support line and set a new low while both RRG-Lines have turned below 100 and started rotating CVX into the lagging quadrant.
Watch out for a break below support at $ 110 as that will trigger a decline in price which will fuel further relative deterioration.
Good and getting better in the leading quadrant
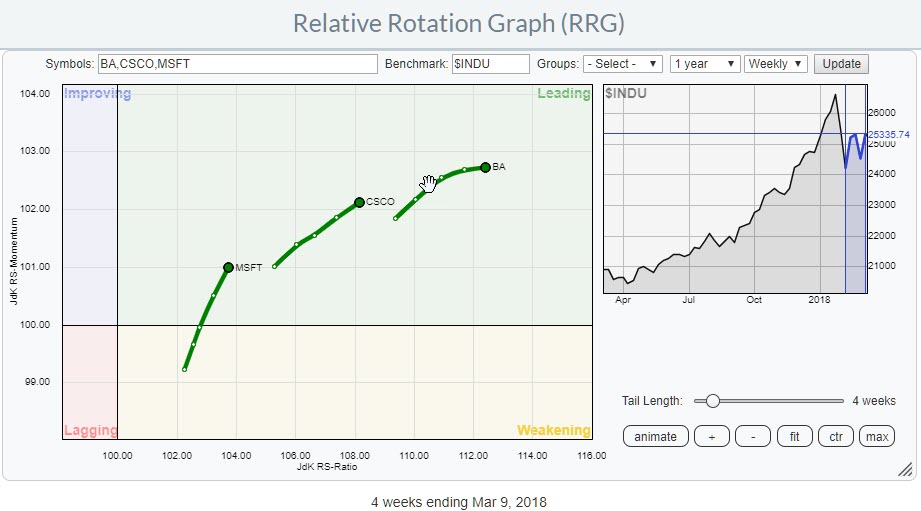
Inside the leading quadrant, I have picked three stocks to watch on a regular chart. They are MSFT, CSCO, and BA.
MSFT and BA rotated back up from weakening into leading again while CSCO initially moved a bit sideways upon entering the leading quadrant but now starts to gain on both axes making it one of the more promising stocks.
Boeing Co. - BA
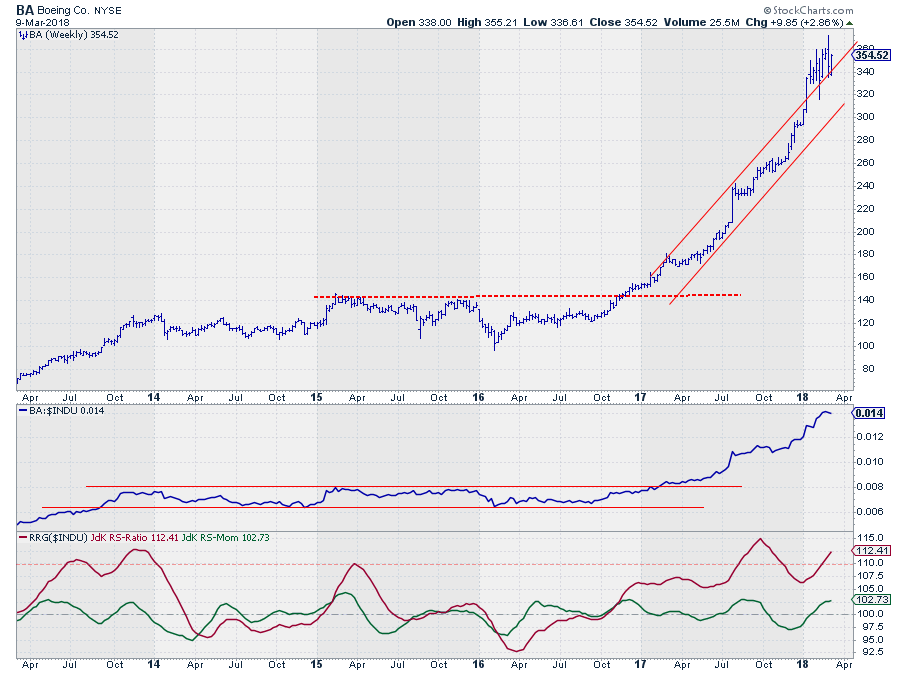
There is no doubt that BA is the strongest stock in the DJ Industrials universe. The recent upward break out of the already rising channel only confirmed that strong status.
From a relative point of view, all looks good, the RS-line continues to march higher and both RRG Lines are back above 100 again putting BA firmly inside the leading quadrant after a short rotation through weakening.
Cisco Systems Inc. - CSCO

Another very strong price chart that continues to push to new highs. The break of the RS-line out of a down-sloping consolidation and above former relative highs also confirms strength from a relative perspective.
As the JdK RS-Ratio line is reaching historically high levels some loss of momentum is getting increasingly likely but you never know when or for how long.
This makes this a typical situation to hold when you already own and buy in case of a decline/dip.
Microsoft Corp. - MSFT
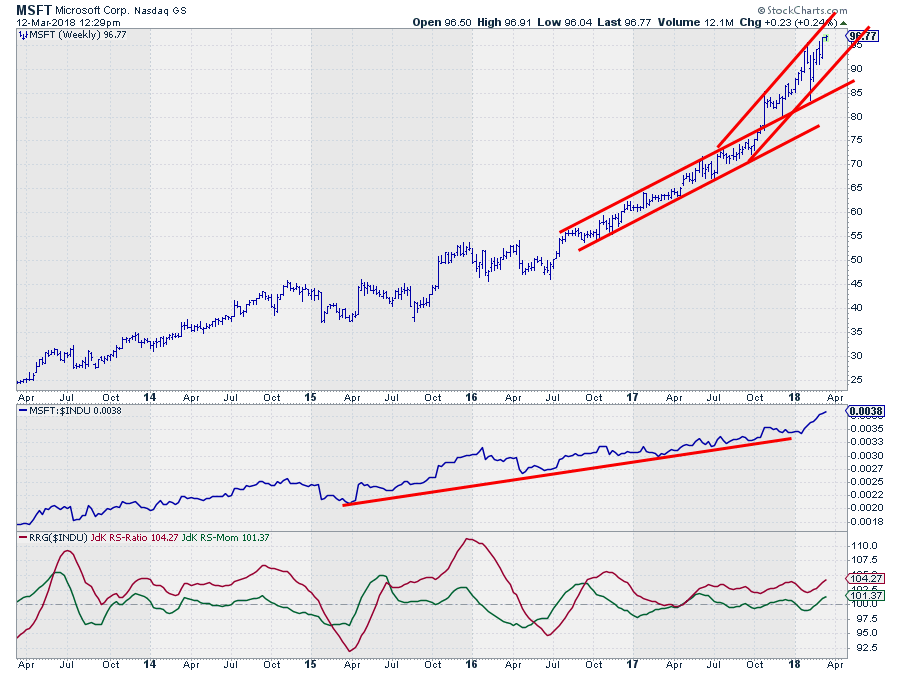 After breaking upwardly out of its rising trend-channel MSFT continued strongly higher and is still well within the boundaries of the new, steeper, channel.
You can see the difference in relative strength between MSFT and CSCO. Where CSCO is at "high" levels, CSCO still has plenty of room to move higher in historical perspective.
Combine that with the recent push to new highs in the raw RS-Line and MSFT is a candidate that offers perspective.
An opportunity inside weakening
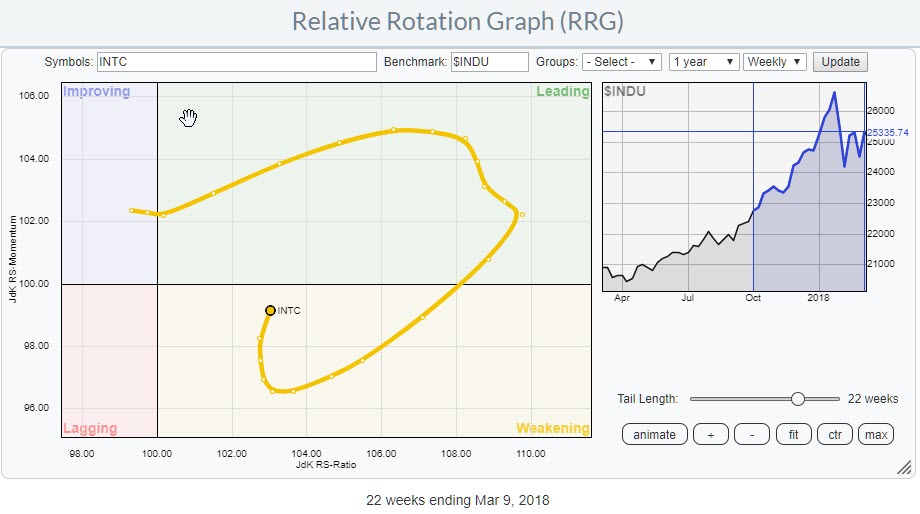 The extended tail of INTC on the RRG image above shows how the stock entered the leading quadrant late October 2017 and continued its rotation further into that part of the RRG. The recent turn back up while inside the weakening quadrant makes INTC a stock to watch for opportunities.
Intel Corp. - INTC
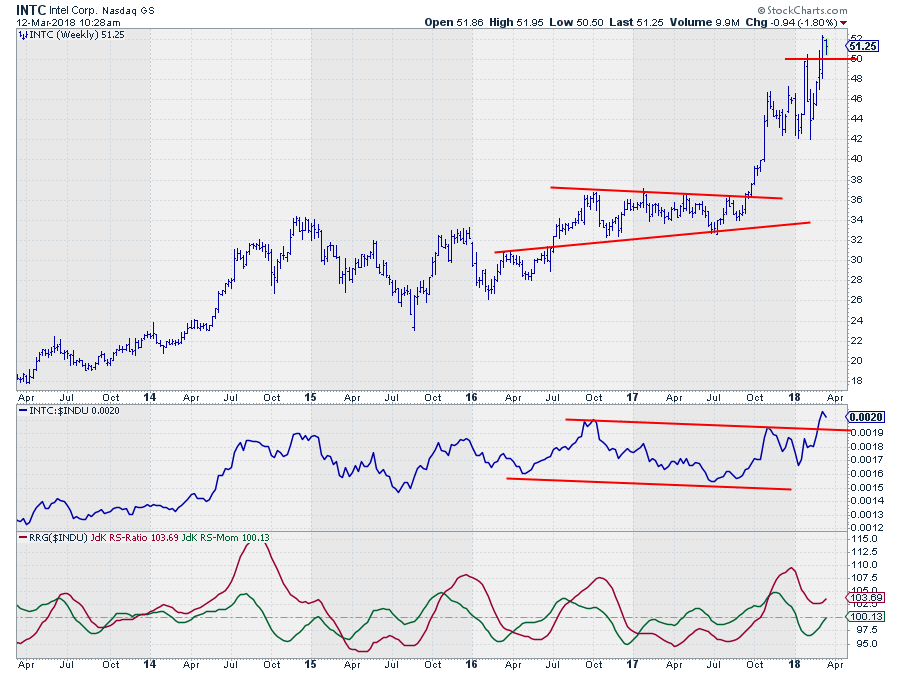
Recently INTC broke to new highs on both the price- and the relative chart while the JdK RS-Ratio bottomed out above the 100-level.
INTC looks ready for a new move higher.
Let me know what you think of this usage of RRG in the comments? If you want to receive a notification when a new article in the RRG blog is published? Simply "Subscribe" and leave your E-mail address.
Julius de Kempenaer | RRG Research
RRG, Relative Rotation Graphs, JdK RS-Ratio, and JdK RS-Momentum are registered TradeMarks ®; of RRG Research
Follow RRG Research on social media:
If you want to discuss RRG with me on SCAN, please use my handle Julius_RRG so that I will get a notification.
