 On Monday 21 and Tuesday 22 May I stepped in for Erin Swenlin and acted as the co-host to Tom Bowley in the Market Watchers Live show. Clearly, we talked a lot about RRGs but as MWL is not all about RRG I wanted to bring something different to the table.
Ever since Relative Rotation Graphs came to life I told people to use them in combination with "something else" as using them (or any other available TA-tool) in isolation would be too limited IMHO.
Whatever "something else" should be is totally up to the user and should, I think, depend on their risk appetite, trading- or investment style, investment horizon, etc.
Merging trend-following with trend-ending
Among the many TA-based trading strategies that are out there, we can see two big categories. On one hand, the trend following strategies, aiming to pick up a trend and follow it as long as possible and on the other hand strategies that try to benefit from and pick trend-reversals or trend-ending patterns.
One of the things I have been "playing around" with is the idea to combine the trend-following RRG concept with trend-reversal strategies like Tom DeMark's sequential or combo strategies or a number of strategies as described by Larry Connors and Linda Raschke in their book Street Smarts (1996).
The "Turtles" and "Turtle Soup"
For this occasion, I picked a strategy labeled "Turtle Soup" as described by Connors and Raschke.
The name came up as a humorous reference to the famous group of traders called the "Turtles" which was a result of an experiment set up by two famous traders called Richard Dennis and William Eckhardt in which Dennis wanted to prove his partner that anyone could be taught to trade.
The turtles operated a trend following strategy with very strict money management guidelines. Due to the nature of trend following strategies they had fairly large drawdowns and a low win/loss ratio as a result of a significant number of false breakouts. The Turtle soup strategy tries to take the opposite side of these false breakouts.
The strategy is not a full-fledged trading strategy with entries and exits and a definite set of money management rules, which makes it perfect for traders to adapt the set-up to their own trading style and risk appetite and embed in their own workflow.
BUY rules for the Turtle Soup setup, SELLs are reversed:
- Today must make a new 20-day low - the lower the better
- The previous 20-day low must have occurred at least four trading sessions earlier. Important!
- After the market falls below the prior 20-day low, place an entry buy-stop slightly above the previous 20-day low. This entry stop is good for today only.
- If the buy-stop is filled, immediately place an initial (Good Till Cancelled) stop just below today's low.
- As the position becomes profitable, use a trailing stop to protect gains. According to the authors, some trades last a few hours while others last a few days.
- Re-Entry rule: If the position is stopped out on either day one or day two of the trade, you may re-enter on a buy-stop at the original entry price level (day one and two only). This should increase the profitability by a small amount.
Here are two recent examples of the setup.
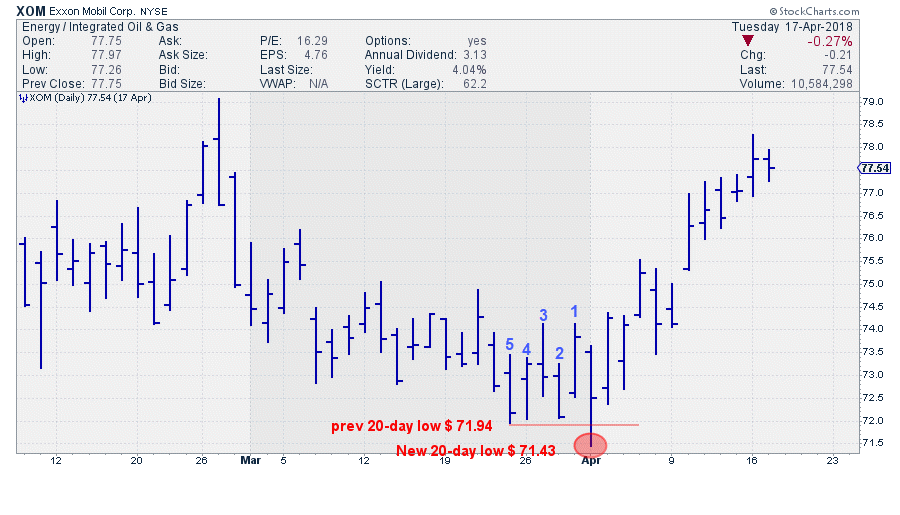 On 2 April, XOM drops to a new 20-day low while the previous 20-day low was set 5 days ago. During the day the price recovers back above that previous 20-day low ($ 71.94), closes at $ 72.50 and then rallies higher over the next few days.
Also for AXP
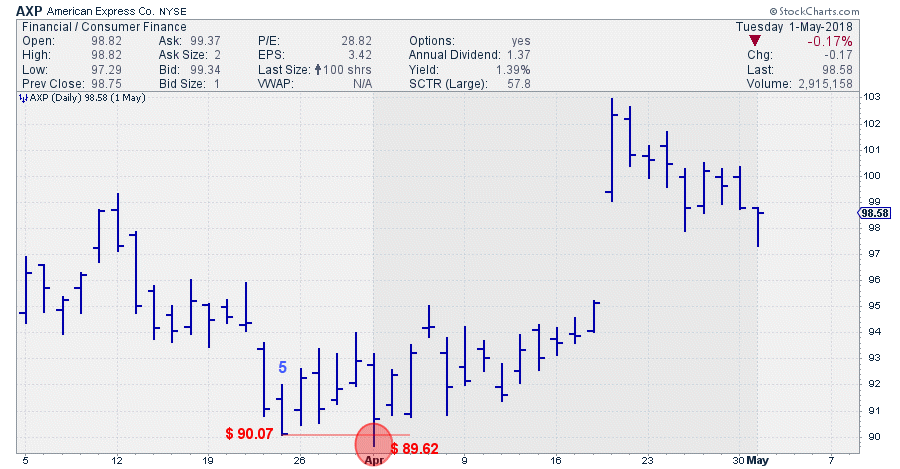 A new 20-day low on 2 April. Previous 20-day low was set on 23 March. During the day AXP recovers back above the 3/23 low ($ 90.07) and reaches a high at $ 95.00 a few days later.
Using the scan engine
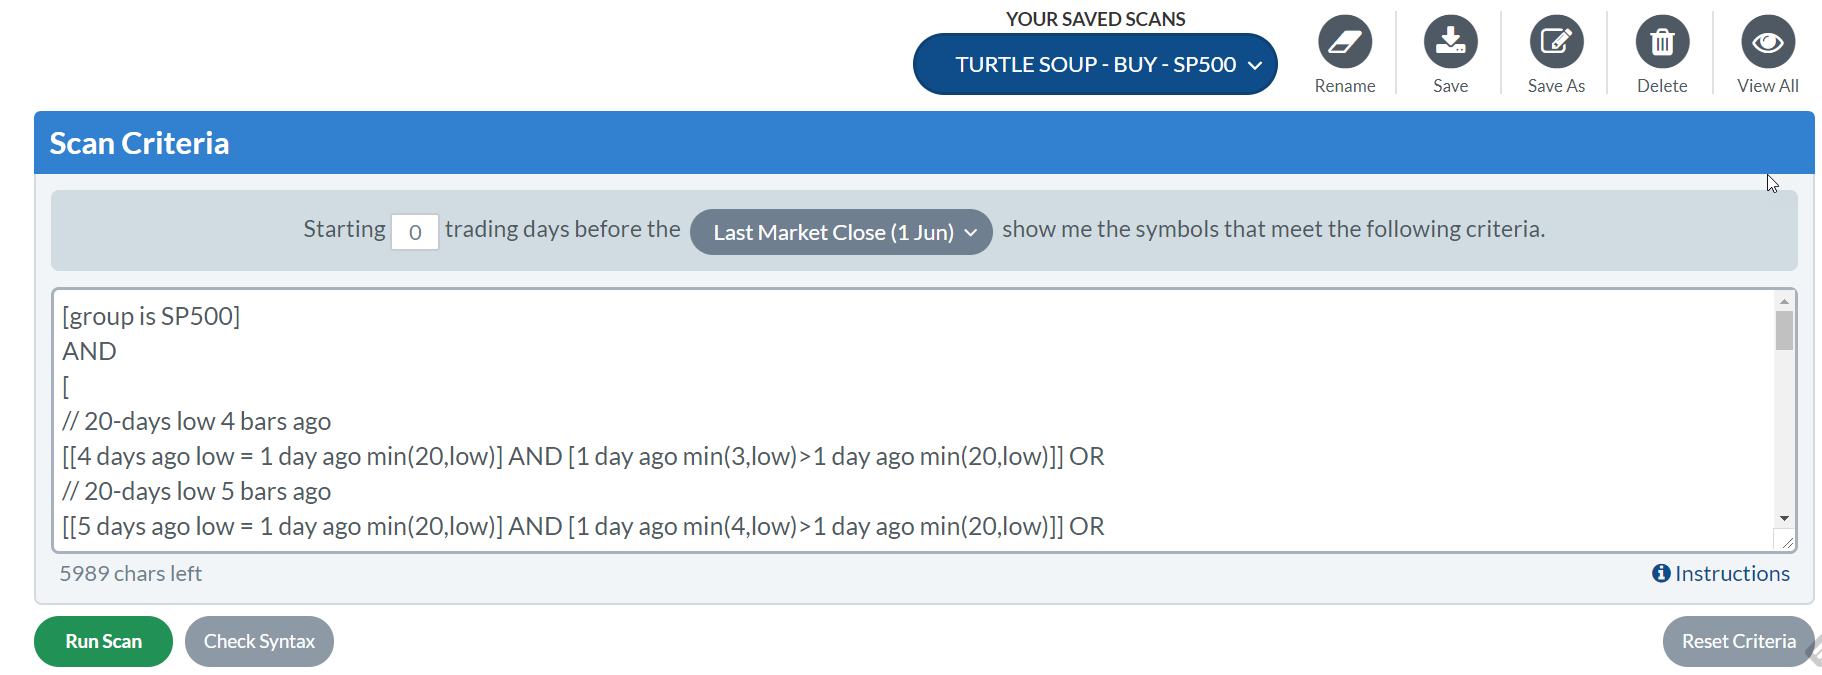
As the rules are fairly simple they lend themselves very well for a scan using the Stockcharts.com scan engine. After a few initial tries I got the hang of using the scan engine and with a little help from Markd on the Stockcharts Answer Network (SCAN) I boiled it down to the code below.
[group is SP500]

AND

[

// 20-days low 4 bars ago

[[4 days ago low = 1 day ago min(20,low)] AND [1 day ago min(3,low)>1 day ago min(20,low)]] OR

// 20-days low 5 bars ago

[[5 days ago low = 1 day ago min(20,low)] AND [1 day ago min(4,low)>1 day ago min(20,low)]] OR

//20-days low 6 bars ago

[[6 days ago low = 1 day ago min(20,low)] AND [1 day ago min(5,low)>1 day ago min(20,low)]] OR

//20-days low 7 bars ago

[[7 days ago low = 1 day ago min(20,low)] AND [1 day ago min(6,low)>1 day ago min(20,low)]] OR

//20-days low 8 bars ago

[[8 days ago low = 1 day ago min(20,low)] AND [1 day ago min(7,low)>1 day ago min(20,low)]] OR

//20-days low 9 bars ago

[[9 days ago low = 1 day ago min(20,low)] AND [1 day ago min(8,low)>1 day ago min(20,low)]] OR

//20-days low 10 bars ago

[[10 days ago low = 1 day ago min(20,low)] AND [1 day ago min(9,low)>1 day ago min(20,low)]] OR

//20-days low 11 bars ago

[[11 days ago low = 1 day ago min(20,low)] AND [1 day ago min(10,low)>1 day ago min(20,low)]] OR

//20-days low 12 bars ago

[[12 days ago low = 1 day ago min(20,low)] AND [1 day ago min(11,low)>1 day ago min(20,low)]] OR

//20-days low 13 bars ago

[[13 days ago low = 1 day ago min(20,low)] AND [1 day ago min(12,low)>1 day ago min(20,low)]] OR

//20-days low 14 bars ago

[[14 days ago low = 1 day ago min(20,low)] AND [1 day ago min(13,low)>1 day ago min(20,low)]] OR

//20-days low 15 bars ago

[[15 days ago low = 1 day ago min(20,low)] AND [1 day ago min(14,low)>1 day ago min(20,low)]] OR

//20-days low 16 bars ago

[[16 days ago low = 1 day ago min(20,low)] AND [1 day ago min(15,low)>1 day ago min(20,low)]] OR

//20-days low 17 bars ago

[[17 days ago low = 1 day ago min(20,low)] AND [1 day ago min(16,low)>1 day ago min(20,low)]]

]

AND
[close <= 1 day ago min(20,low) * 1.01] // un-comment if you want to search for stocks that are close to their 20-day low and potentially ready for a TS setup
//[low < 1 day ago min(20,low) ] // un-comment if you want to scan for stocks that set a 20-day low TODAY
This scan can be used to find stocks that are close to their 20-day low and potentially triggering the Turtle Soup setup. Or to find stocks, during market hours, that fulfill the criteria AND have actually fallen to a new 20-day low so buy-stops can be placed.
By varying the percentage distance from the most recent 20-day low you can widen or narrow the search. Also when you run the scan on a daily basis you will notice that the number of stocks that actually trigger the complete setup is a lot less than the number of stocks that come close.
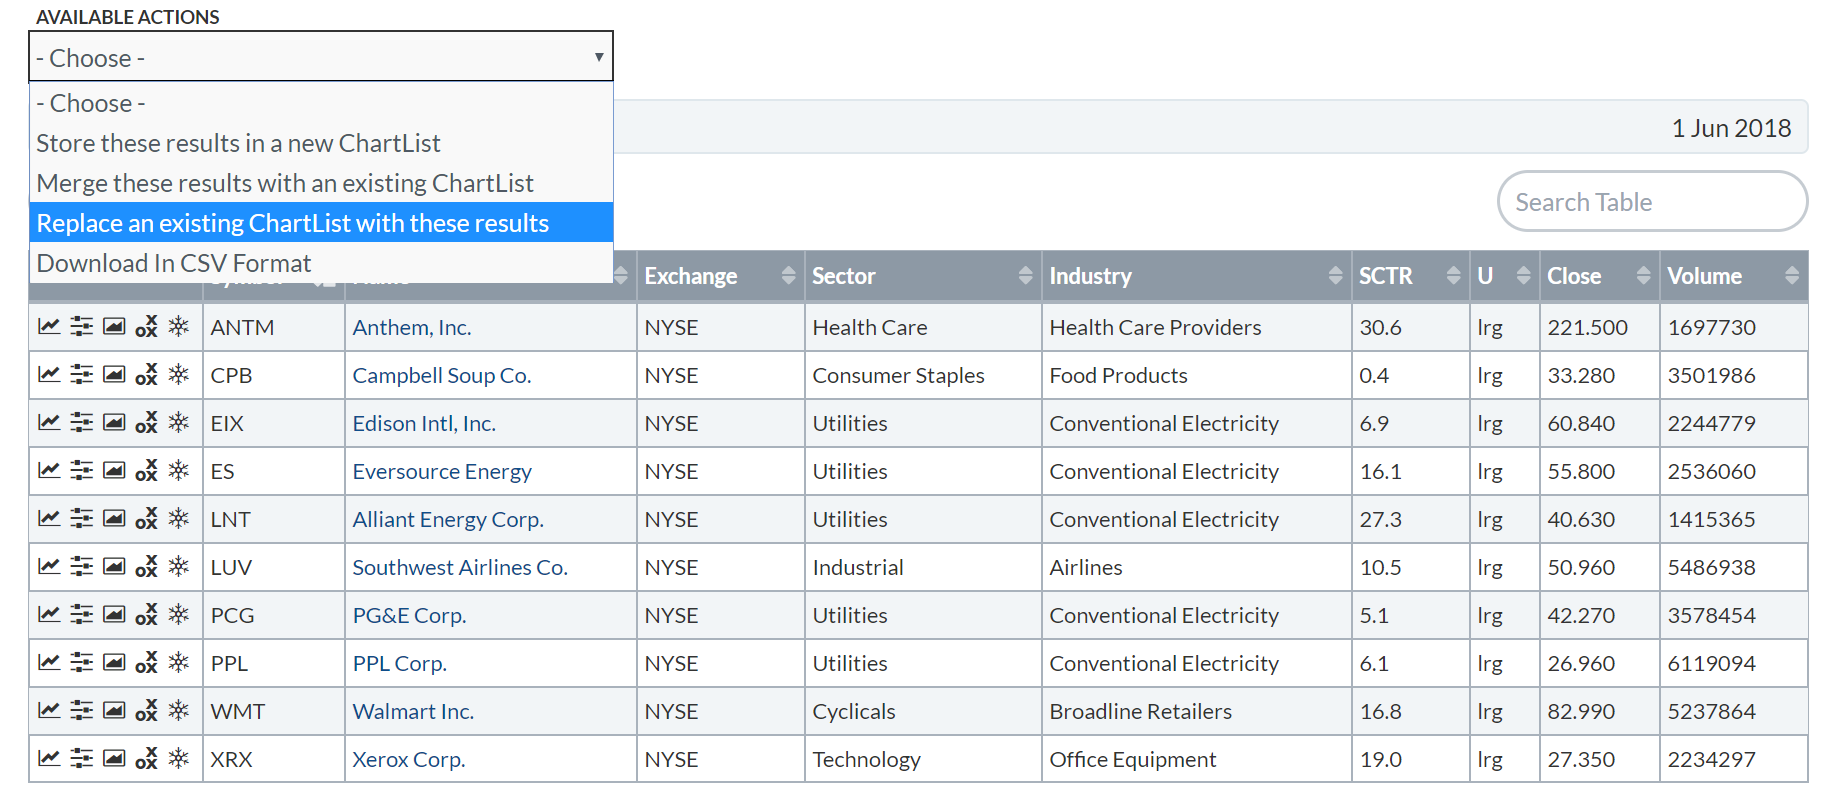
Once the scan is finished you have the option to save the results into a chartlist, this chartlist can then be used as the universe to show on an RRG for further inspection.
Step-by-step
The images below show the various steps in the process:
- Load and run the scan
- Save the results in a chartlist
- View the chartlist as an RRG
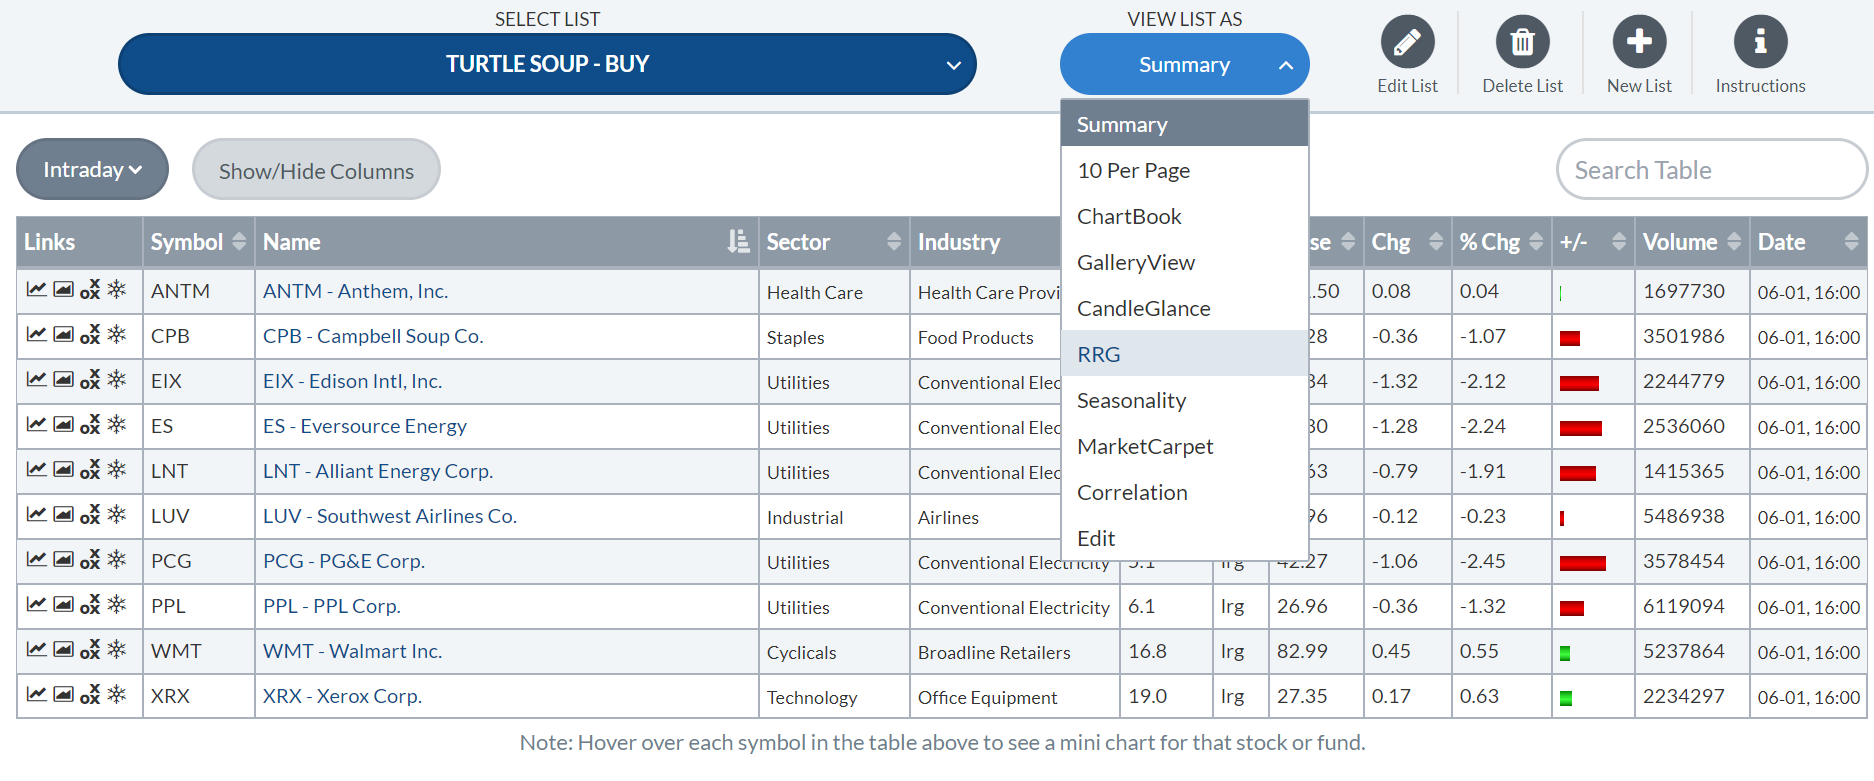
- Study the RRG
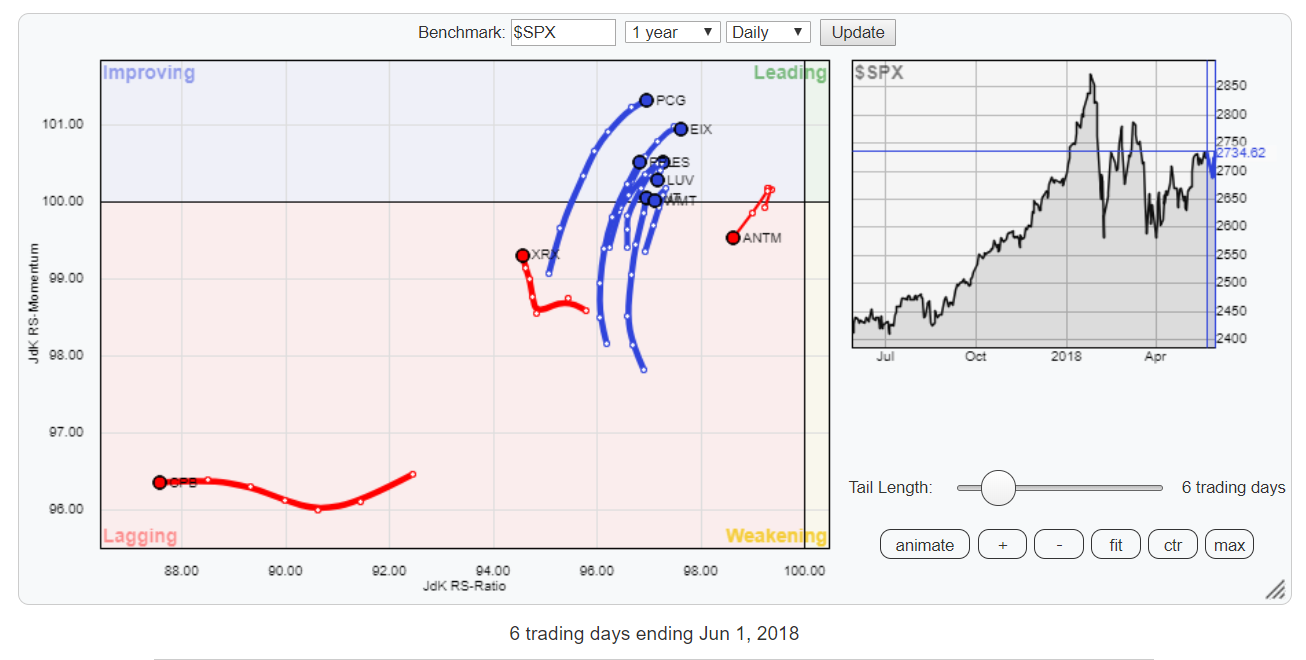
Analyzing the RRG
Looking at the scan results on a Relative Rotation Graph shows a cluster of stocks moving from the lagging quadrant into the improving quadrant which is good as these stocks are in the process of reversing their relative trend against the S&P 500 index. Combining that info with the potential of a trend-ending setup like the Turtle Soup pattern makes these stocks potential trading candidates.
ANTM and CPB are moving at a negative RRG heading making them less attractive as their relative downtrends are still gaining strength. In the case of CPB (Campbell Soup Co.) that might have something to do with the name ;)
XRX seems at "make or break" crossroads which makes it an ideal stock for a TS setup. If the stock drops to a new 20-day low next week a buy stop gets into place and once triggered it could make a nice bounce. If the downward break is legit and the buy stop does not get activated XRX will very likely continue its relative slide against $SPX.
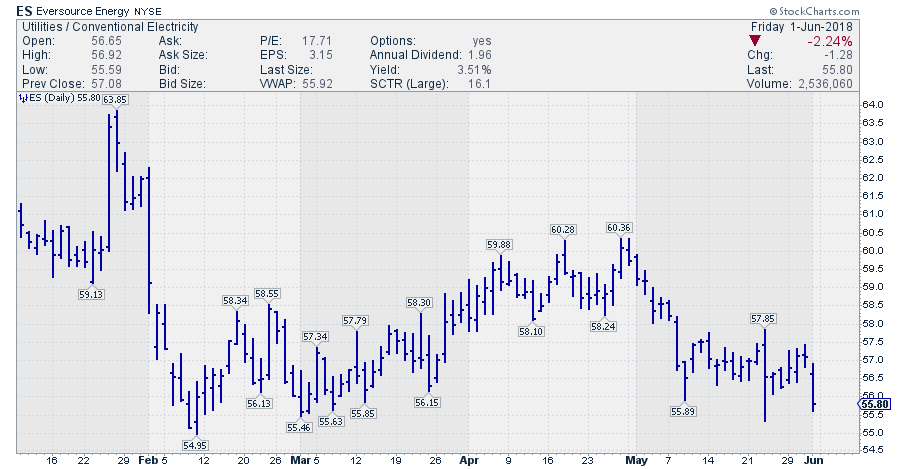
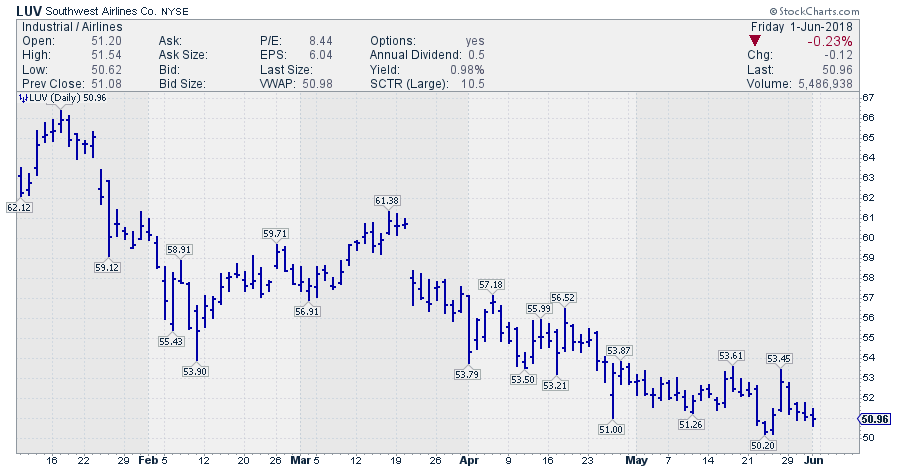
From the stocks, in the "blue" cluster I am watching the following charts for -short term- buying opportunities because they are closer to longer term support levels than some of the other on the list.
Eversource Energy - ES
Southwest Airlines Co. - LUV
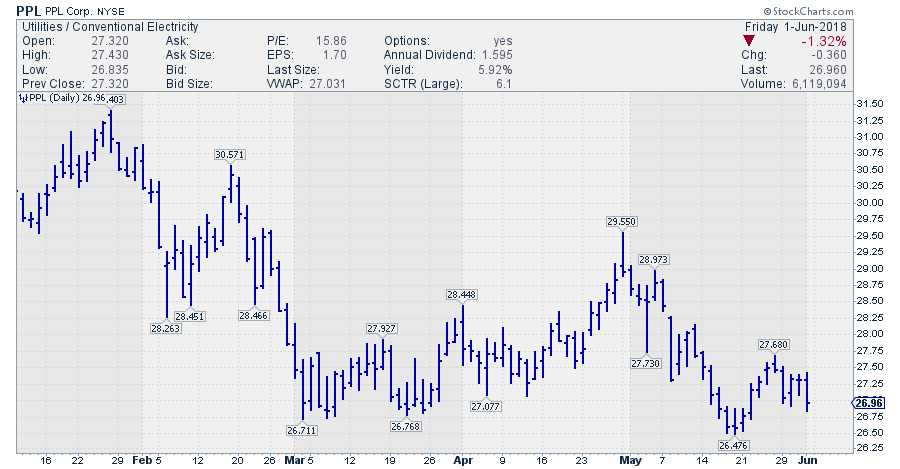
PPL Corp. - PPL
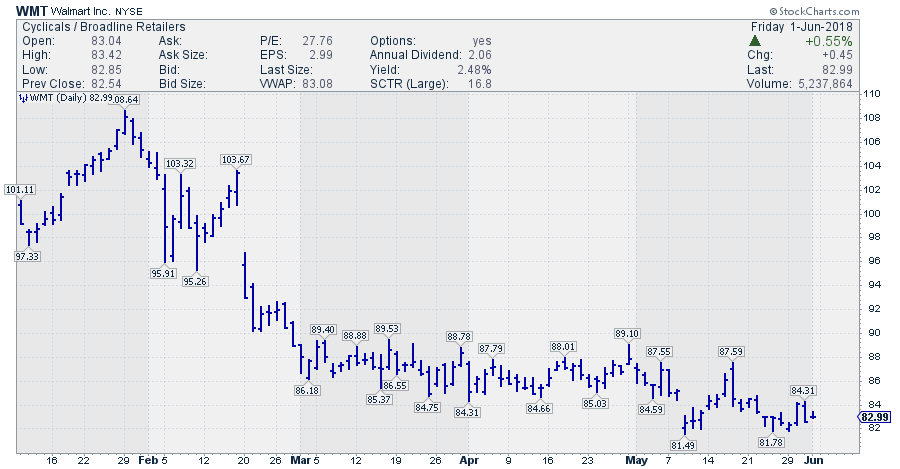
Walmart Inc. WMT
Let me know what you think of this usage of RRG in the comments? If you want to receive a notification when a new article in the RRG blog is published? Simply "Subscribe" and leave your E-mail address.
Julius de Kempenaer | RRG Research
RRG, Relative Rotation Graphs, JdK RS-Ratio, and JdK RS-Momentum are registered TradeMarks ®; of RRG Research
Follow RRG Research on social media:
If you want to discuss RRG with me on SCAN, please use my handle Julius_RRG so that I will get a notification.
