RRG Charts November 30, 2018 at 05:26 AM

After finishing the previous article on plotting breadth indicators on Relative Rotation Graphs I have spent hours and hours on studying probably a couple of thousand different RRGs holding various groups of sectors in combination with their breadth equivalents... Read More
RRG Charts November 20, 2018 at 01:01 PM

In my contribution to last week's Chartwatchers newsletter, I mentioned my current experiment on using breadth indicators on a Relative Rotation Graph... Read More
RRG Charts November 13, 2018 at 03:34 AM
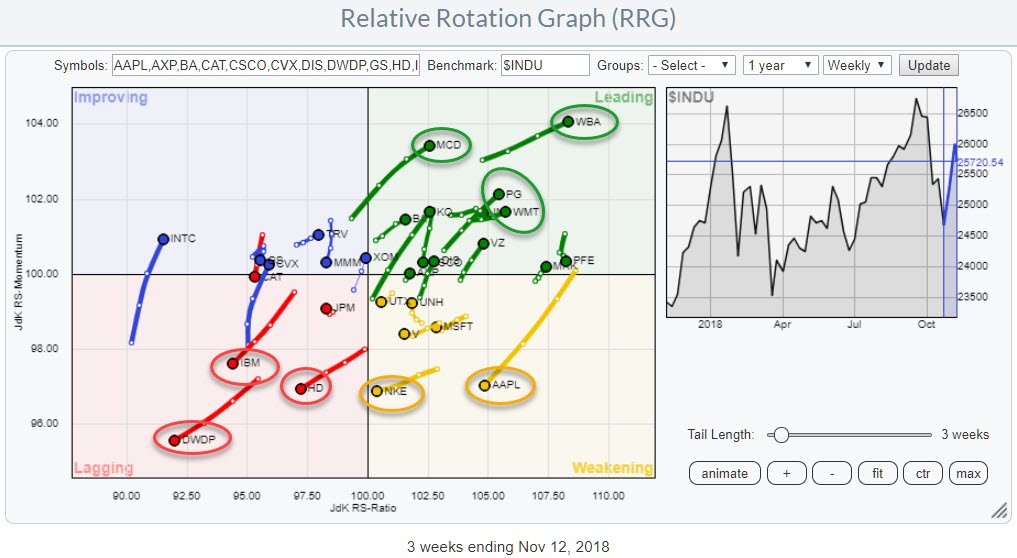
The relative rotation graph above shows the rotation of the 30 DJ Industrials stocks. Watching the interaction on the canvas, a few rotations catch the eye. Inside the lagging quadrant IBM, HD, and DWDP are clearly moving deeper into negative territory... Read More
RRG Charts November 07, 2018 at 05:15 PM
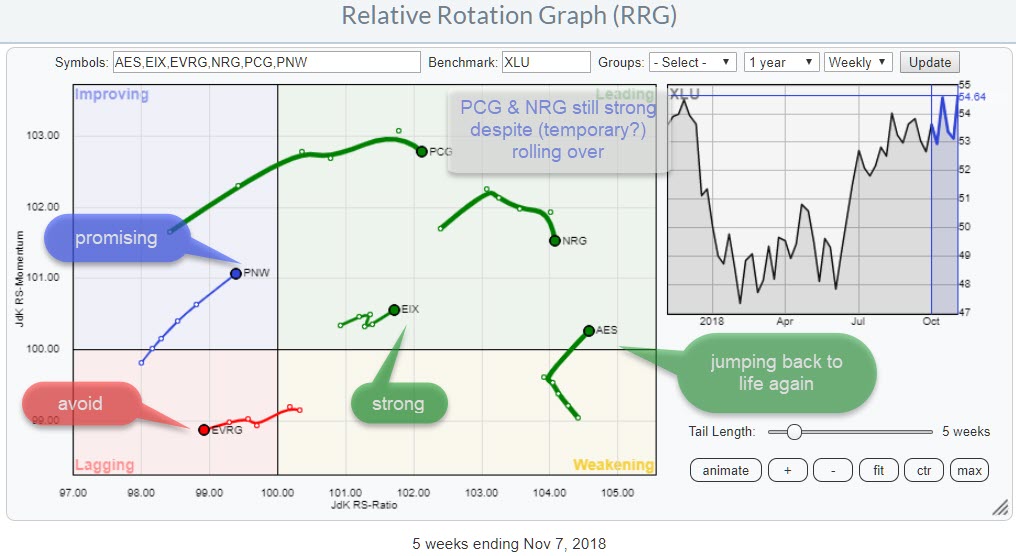
The relative rotation graph above shows a selection of stocks in the utilities sector. I have created this zoomed in version for better visibility. The fully populated RRG can be found here. In this post, I will highlight a few of the stocks shown in the picture... Read More
RRG Charts November 02, 2018 at 12:42 PM
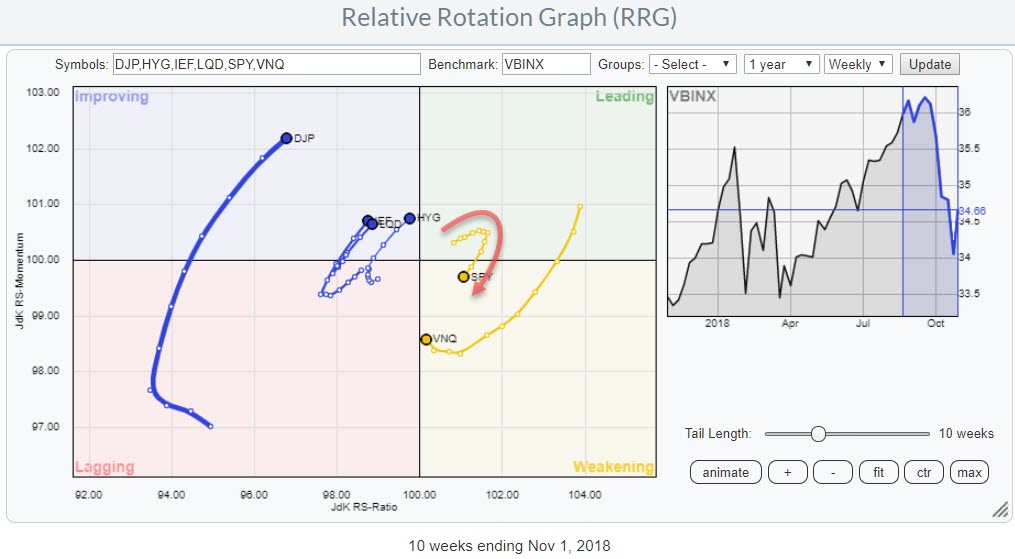
In this blog post, I want to do a quick top-down analysis to arrive at a few stocks that could help investors to provide shelter in case the current hiccup in the market is ..... well a "hiccup... Read More