 It's Friday morning in Amsterdam and I just dropped my daughter off at school. On the way to my office, I usually stop at the local Coffee Company for a cappuccino and reading some, market-related, news, blogs etc.
For some reason, I noticed a lot of talk and articles on factor investing, factor ETFs, factors that drive markets. Pretty much "factors" all over the place. While looking out of the window, yes it was a rainy day, I was thinking about a way to use Relative Rotation Graphs in combination with "factors".
My thought was/is that "factors" can rotate in- and out-of-favor versus each other just like sectors or stocks.
Next thing I know I am browsing the internet looking for "factors", "investment factors", and "factor ETFs" etc. Believe me, it's a pretty crowded landscape ;)
Then I remembered that David Keller, one of our fellow commentators here on StockCharts.com, had written an article on Factor ETFs a while ago so I looked it up for a re-read and see if I could use Dave's input.
Dave uses four factor ETFs in that article, these are:
Momentum
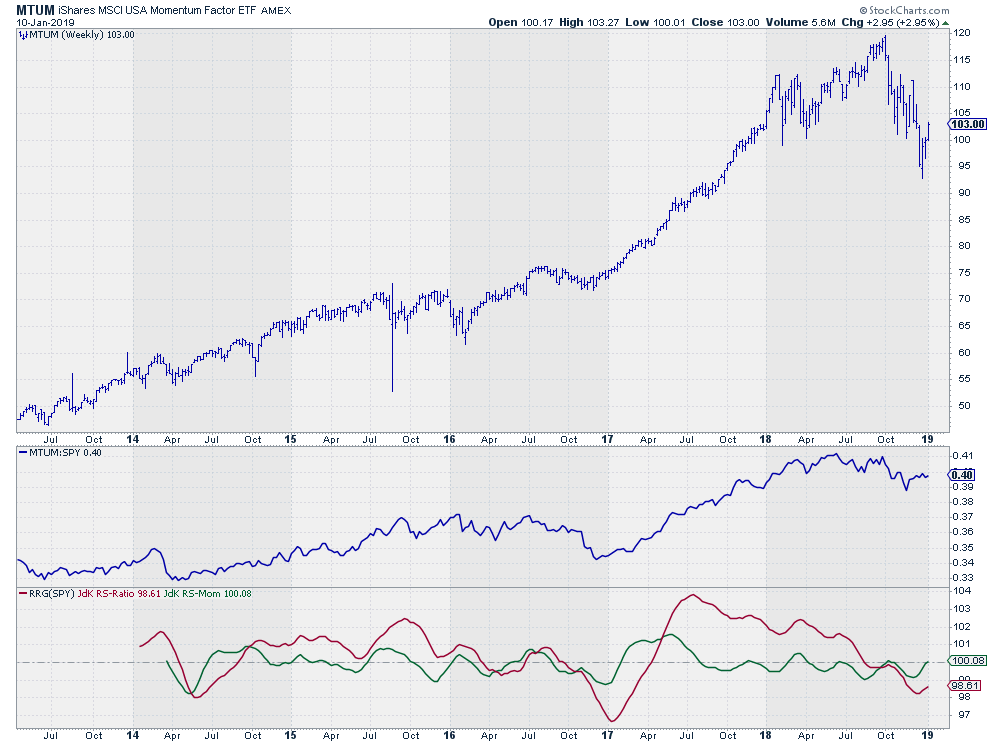
This factor is tracked by MTUM which is the iShares MSCI USA Momentum factor ETF. According to iShares this is the objective of that ETF.
The iShares Edge MSCI USA Momentum Factor ETF seeks to track the performance of an index that measures the performance of U.S. large- and mid-capitalization stocks exhibiting relatively higher momentum characteristics, before fees and expenses.
All data and stats for that ETF can be found on the iShares website.
Here is the, weekly, chart in combination with relative strength and RRG-Lines against SPY.
Quality
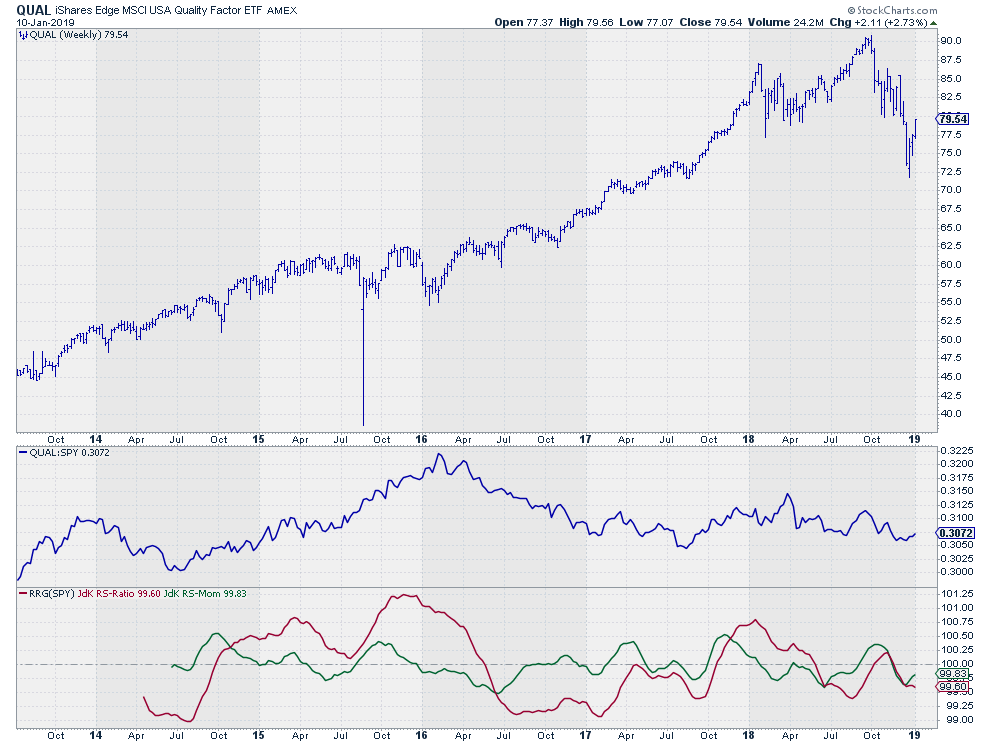
This factor is tracked by QUAL which is the iShares MSCI USA Quality factor ETF. The objective for this ETF is.
The iShares Edge MSCI USA Quality Factor ETF seeks to track the investment results of an index that measures the performance of U.S. large- and mid-capitalization stocks as identified through three fundamental variables: return on equity, earnings variability and debt-to-equity.
Data and stats on iShares.
The chart
Size
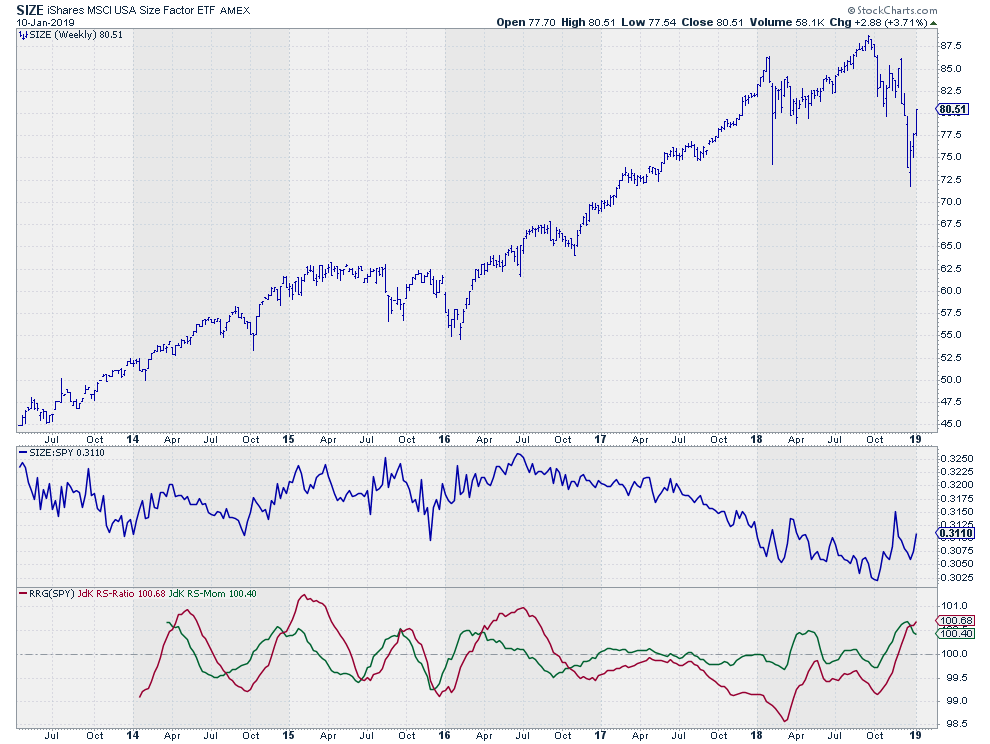
The "size" factor is tracked by SIZE which is the iShares MSCI USA Size factor ETF. Its objective is.
The iShares Edge MSCI USA Size Factor ETF seeks to track the investment results of an index composed of U.S. large- and mid-capitalization stocks with relatively smaller average market capitalization.
Data and Stats on iShares.
The chart.
Value
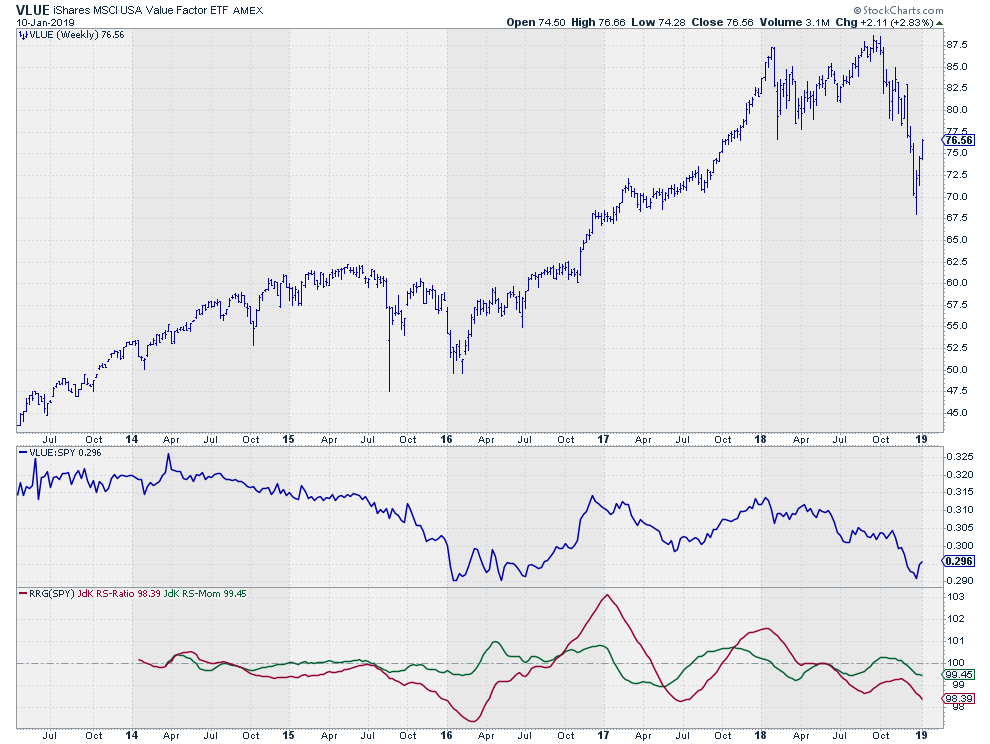
The fourth factor he identified is VLUE, the iShares MSCI USA Value factor ETF. The objective.
The iShares Edge MSCI USA Value Factor ETF seeks to track the performance of an index that measures the performance of U.S. large- and mid-capitalization stocks with value characteristics and relatively lower valuations, before fees and expenses.
Data and stats on iShares.
The chart
Correlation
When looking at these charts, at first you may find that all look similar. And that's true, to a certain extent.
A good tool to check if markets are "the same" is the correlation. In the chart below I have plotted SPY at the top and then four correlation charts for each of the factor ETFs.
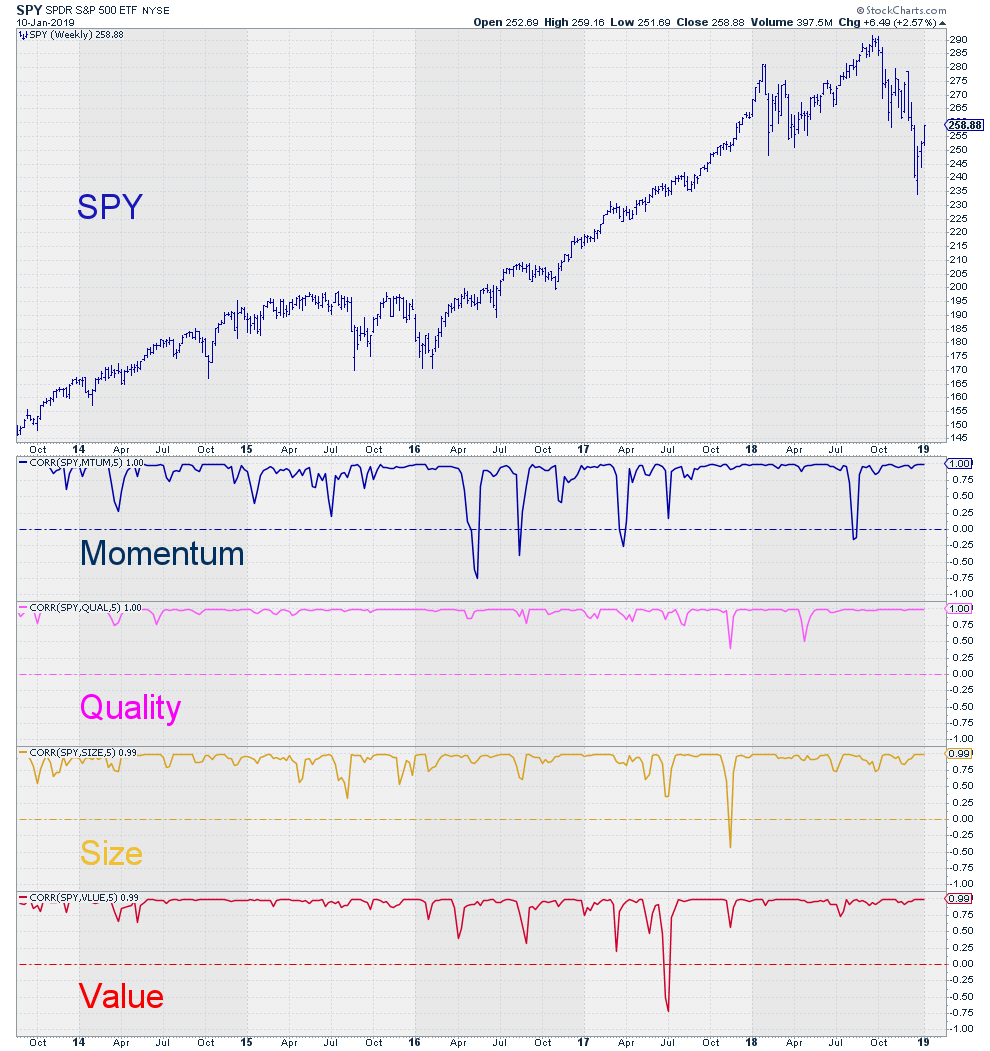
All four factors have the tendency to stay very close to 1 which means a perfect correlation or in other words, the two securities move exactly alike. But from time to time the correlations dip, sometimes even below zero which means that the two securities move in opposite directions, these are the times were Alpha (outperformance) can be generated.
These drop-offs in correlation with SPY are also the periods where relative strength will start to play an even bigger role and can be used to determine which factor is more dominant.
From the four correlations charted above Momentum and Value seem to be least correlated, in other words, they offer the best opportunities for outperformance over SPY.
Other factors
While searching for these factor ETFs I ran into a few other factors that may be of interest to monitor. These are
(Low) Volatility
USMV - iShares MSCI USA Minimum Volatility ETF : iShares Data - Chart
Dividend
DVY - iShares select Dividend ETF: iShares Data - Chart
Equal Weight
EUSA - iShares MSCI USA Equal Weighted ETF: iShares Data - Chart
Relative Rotation Graph
Putting all these factors on a Relative Rotation Graph against SPY gives this picture.
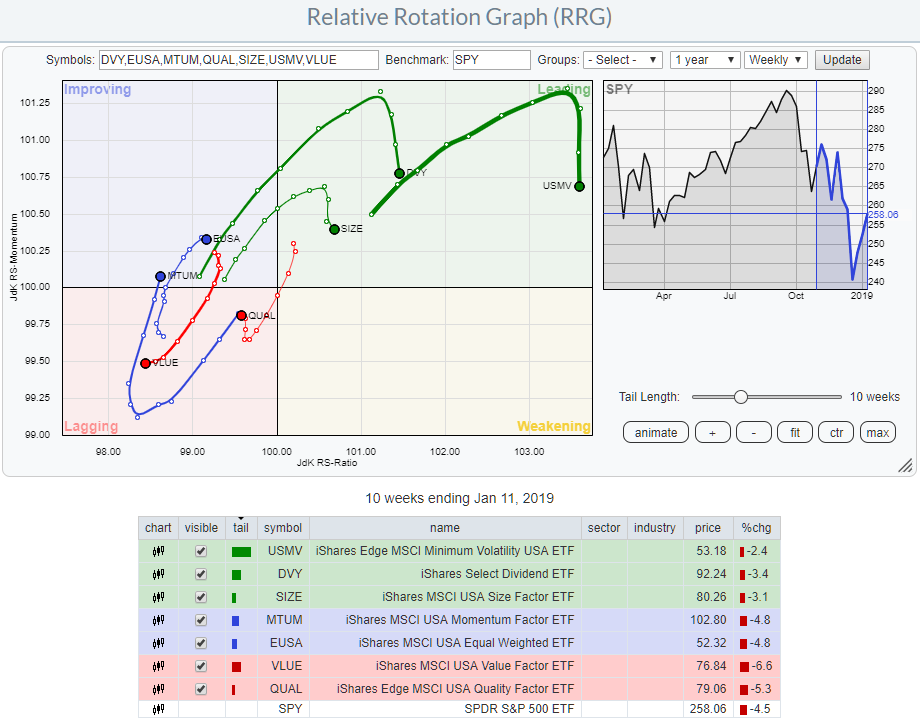 And it's interesting to see that, just like sectors, these factors rotate in and out of favor around the benchmark, in this case, SPY.
Once the market started to roll over, DIV, SIZE, and USMV rotated towards the leading quadrant while especially MTUM pushed deeper into lagging.
At the moment we see DIV, SIZE, and USMV rolling over inside leading again while MTUM curled up and has just entered the improving quadrant together with EUSA.
VLUE and, to a lesser extent, QUAL, seem to be the factors to avoid for the time being.
Let me know what you think of this usage of RRG in the comments below. If you would like to receive a notification when a new RRG blog article is published, simply "Subscribe" with your email address using the form below.
Julius de Kempenaer | RRG Research
RRG, Relative Rotation Graphs, JdK RS-Ratio, and JdK RS-Momentum are registered TradeMarks ®; of RRG Research
Follow RRG Research on social media:
If you want to discuss RRG with me on SCAN, please use my handle Julius_RRG so that I will get a notification.
