RRG Charts April 30, 2019 at 12:07 PM
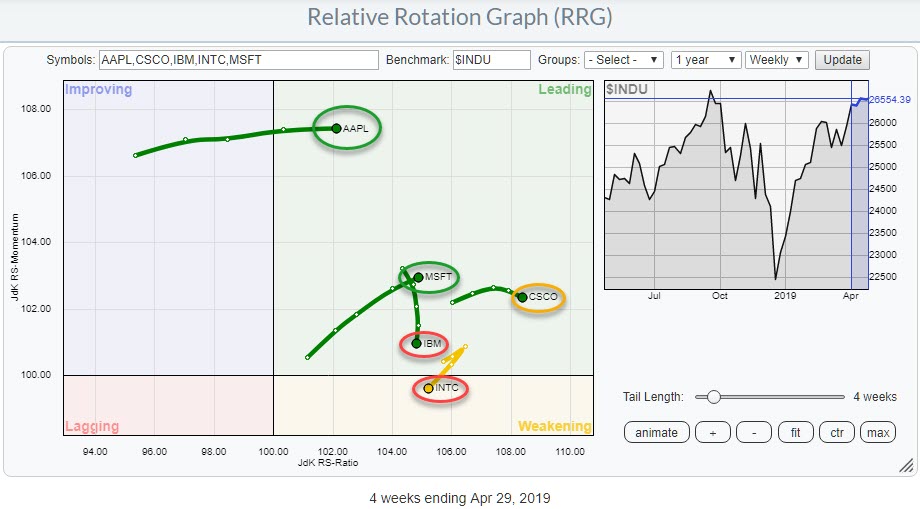
The Relative Rotation Graph shows the five technology stocks inside the DJ Industrials index, all of which are at the right-hand side of the RRG. This is not surprising, considering the strong rotation of the sector as a whole against the S&P 500 index... Read More
RRG Charts April 23, 2019 at 03:11 AM
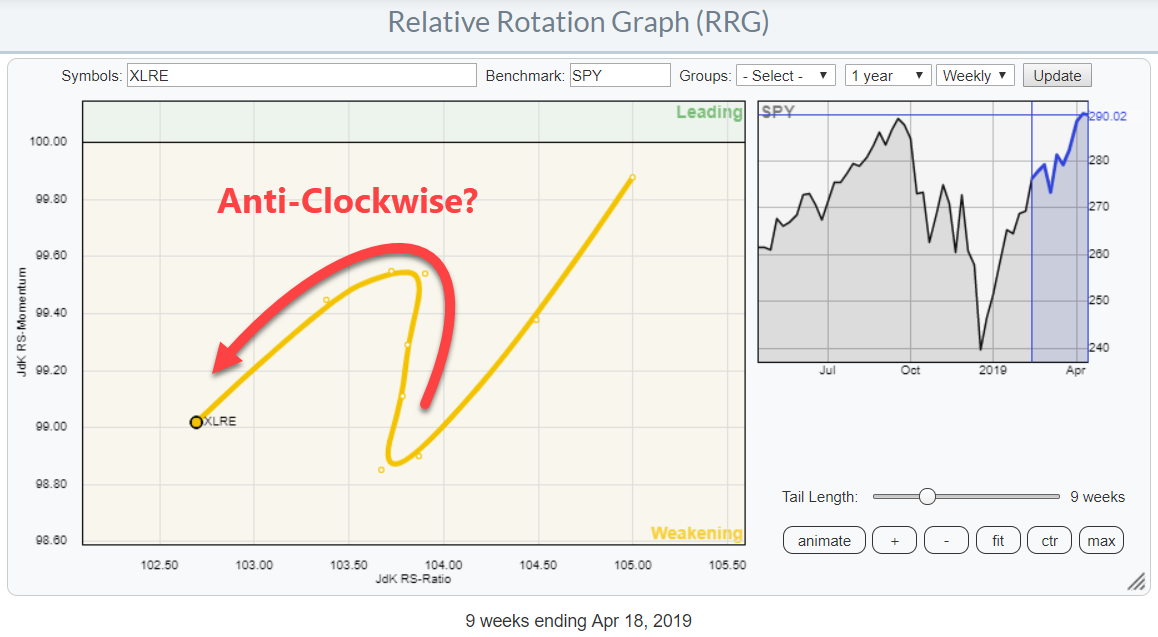
Last Thursday, 18 April, was the third Thursday of the month, my regularly scheduled guest appearance on MarketWatchers LIVE. As Tom Bowley was enjoying a well-deserved day off, it was just me and Erin on duty... Read More
RRG Charts April 06, 2019 at 12:51 PM
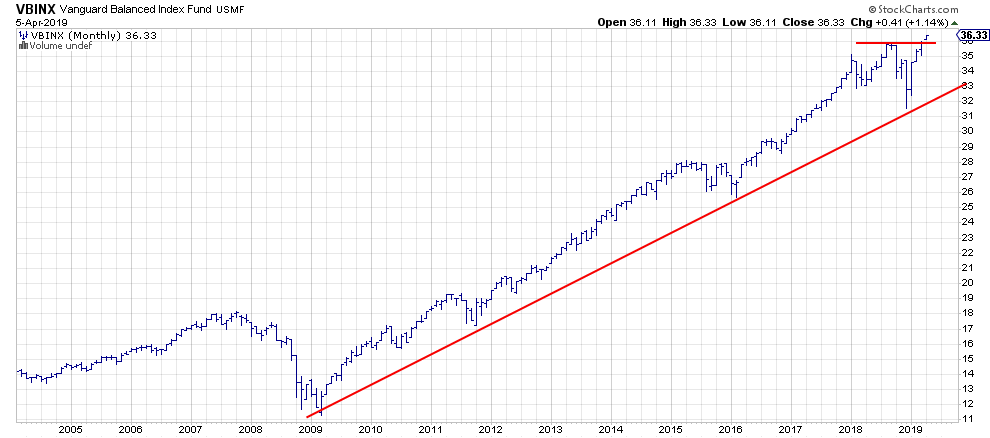
For asset allocation analysis, I generally use VBINX, a balanced index fund by Vanguard that holds 60% in stocks and 40% in a mix of different bonds. This balanced portfolio (total return basis) just broke to new highs this week... Read More