RRG Charts June 30, 2019 at 08:10 AM
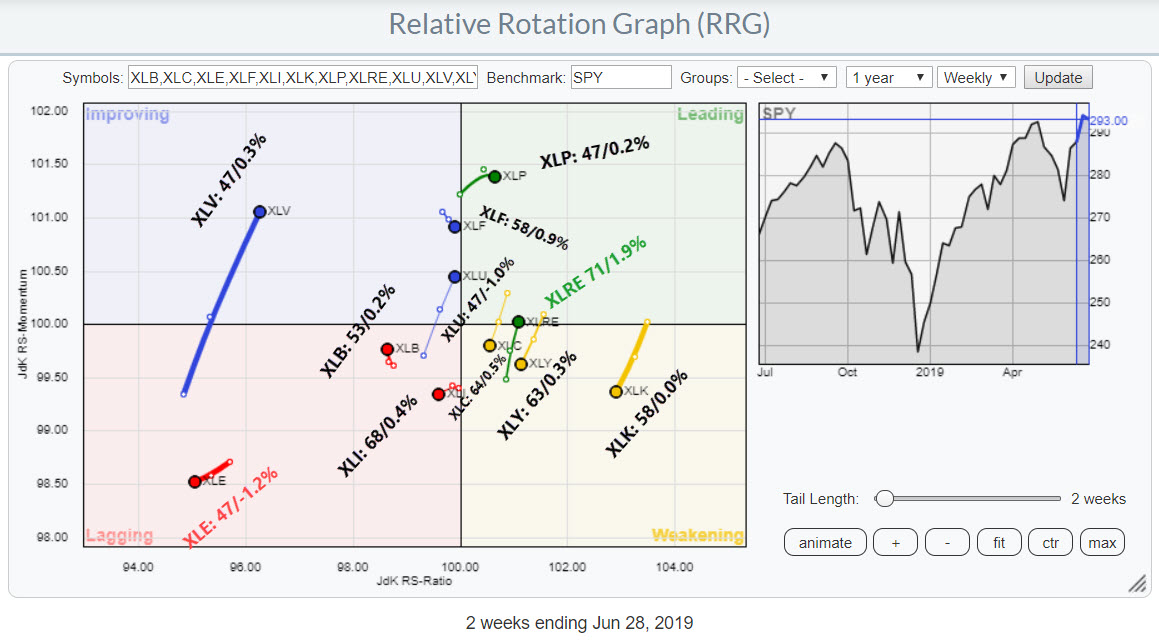
In my last DITC contribution, I wrote about the Real Estate sector, which is crossing over into the leading quadrant at the same time as the seasonality chart for that sector indicates that, over the last 20 years, XLRE closed the month of July higher 71% of the time, with an ave... Read More
RRG Charts June 15, 2019 at 08:37 AM

First of all, let me say that I really appreciate any feedback and comments I get on any of my articles, either via DISQUS below each blog post, via email or in SCAN. I do read all of them and I try to answer most of them, I think my response rate is above 90%... Read More
RRG Charts June 05, 2019 at 12:37 PM
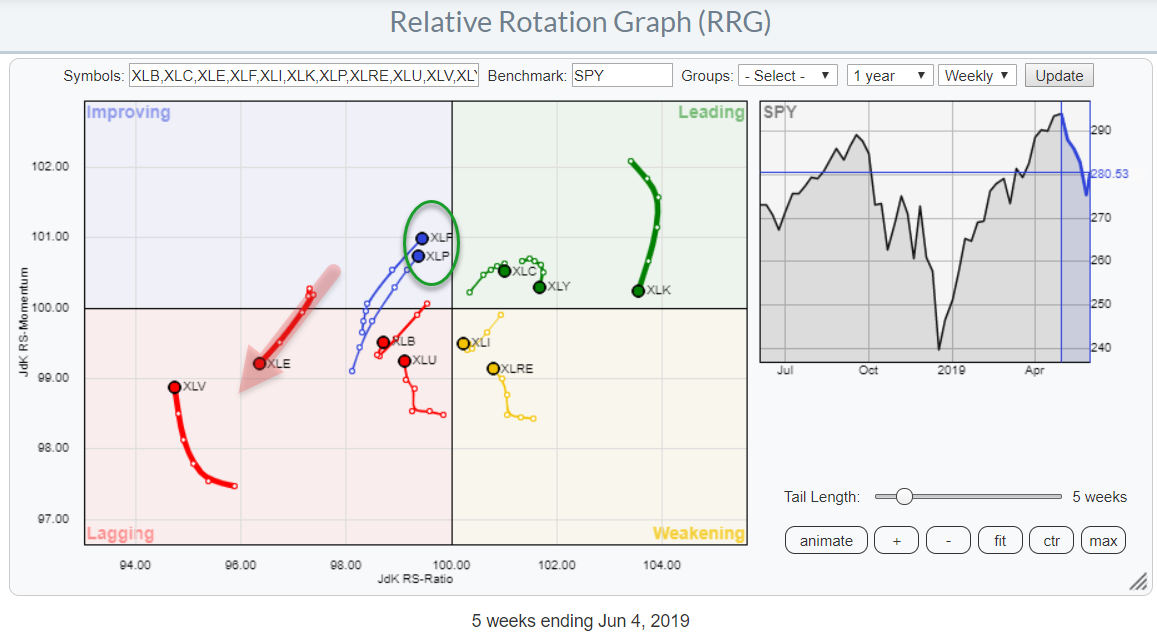
The chart above shows the relative rotation for US sectors against the benchmark S&P 500. Over the last five weeks, the tails for Consumer Staples (XLP) and Financials (XLF) started to move in a similar fashion. Both are heading towards the leading quadrant... Read More