 Last night (Sunday 7/7) the Dutch women's soccer team played the World Cup final against Team USA. I am not a huge soccer fan but, as a Dutchie, you have to catch at least part of that event! It did not work out for us, so congrats to the American girls for a game well played.
I have to admit that I did try to come up with something catchy and compare the S&P with the Dutch AEX Index ($AEX), but that did not work very well for us either ;)
The chart of choice, of course, was the Relative Rotation Graph showing various international stock market indexes.
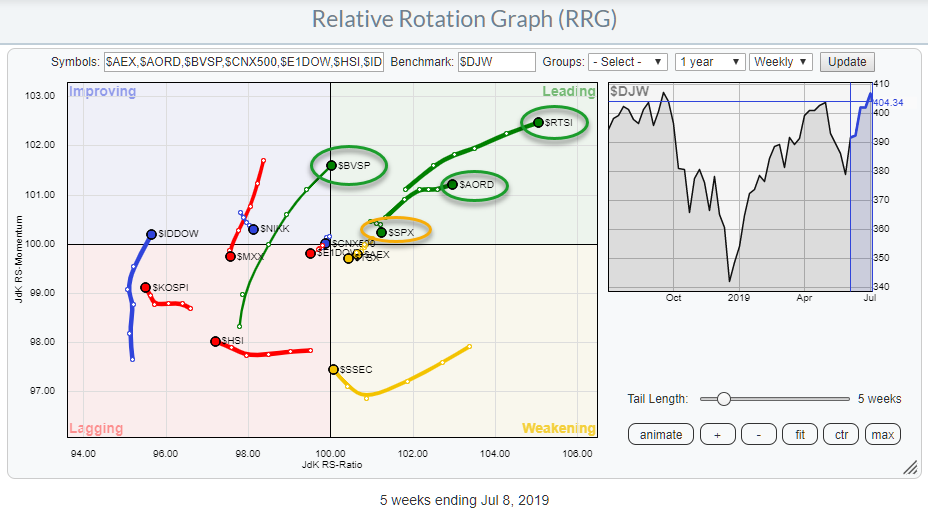 This Relative Rotation Graph shows the rotation for international stock market indexes against the Dow Jones World Index. At the moment, there are four markets positioned inside the leading quadrant, the US ($SPX), Brazil ($BVSP), Russia ($RTSI) and Australia ($AORD).
Three out of these four are at a positive RRG-Heading, between 0 and 90 degrees. The only one rolling over and heading downward toward the weakening quadrant is the S&P 500.
This Relative Rotation Graph is available as a pre-defined group in the drop-down menu, so you do not have to collect and manually type in the symbols that you would like to compare on the RRG.
Russia
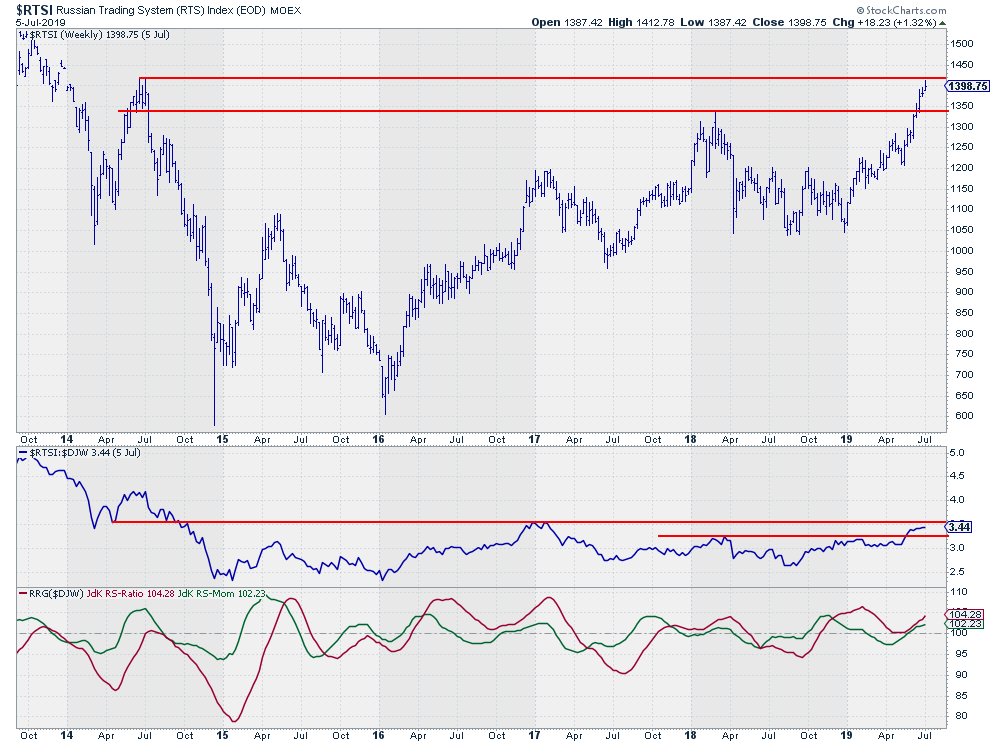 The tail for $RTSI ranks highest on the JdK RS-Ratio scale, which makes it the most mature relative uptrend at the moment.
$RTSI crossed over into the leading quadrant in November last year, when both RRG-Lines crossed above the 100-level. After the initial relative rally, this market rotated through weakening but managed to get back into the leading quadrant in May and is now working its way higher in the second leg of this trend.
On the price chart, $RTSI is nearing an overhead resistance level coming off the 2014 high, which may cap upside potential in the near term. Also, on the relative chart, $RTSI is running into overhead resistance.
In both cases, there is good support that should be able to catch corrective moves. This is a mature trend that is probably better bought on dips instead of chasing it higher.
Australia
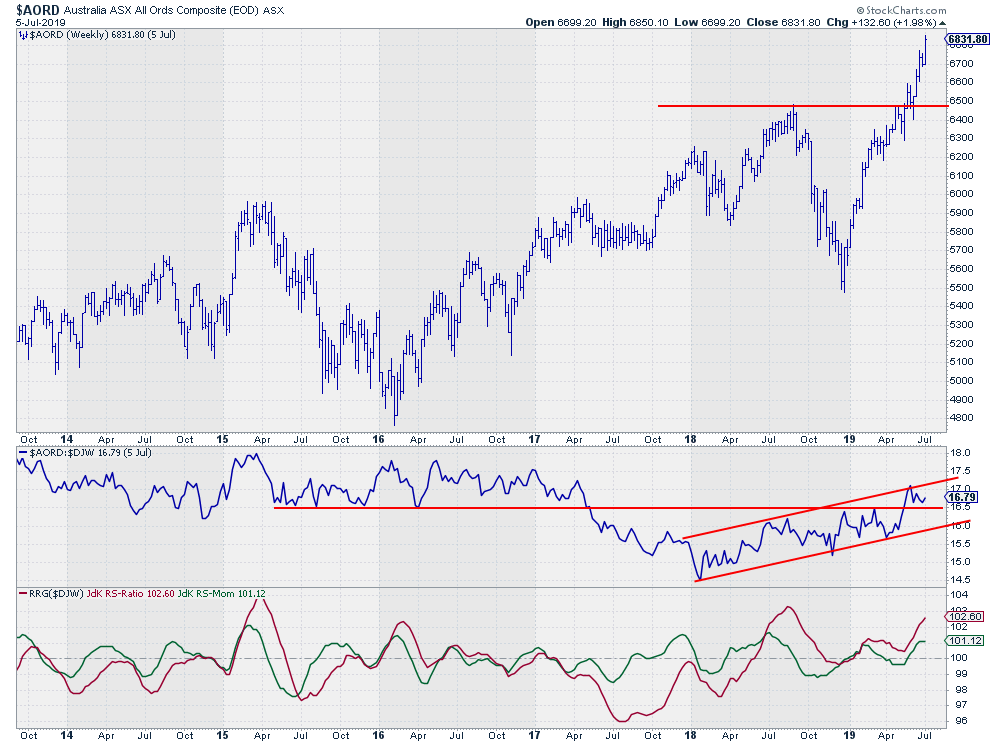 Another mature relative trend is seen for Australia's $AORD index.
This market started to improve against the rest of the world in May 2018, when the RS-Line turned around. The RRG-Lines picked up on that shift in relative strength by crossing above 100, pushing $AORD into the leading quadrant on the RRG.
The RS-Line then started to develop a rising trend channel, which ran into resistance towards the end of 2018. This caused the tail to very briefly dip through the lagging quadrant, almost like a "stop-and-go" touchdown of a plane on the runway.
Since January, $AORD has already completed one rotation through leading and back into weakening and is now well into the second leg of that relative trend. The break above horizontal resistance on the RS-line is another positive that will help to provide support in the next few weeks.
Brazil
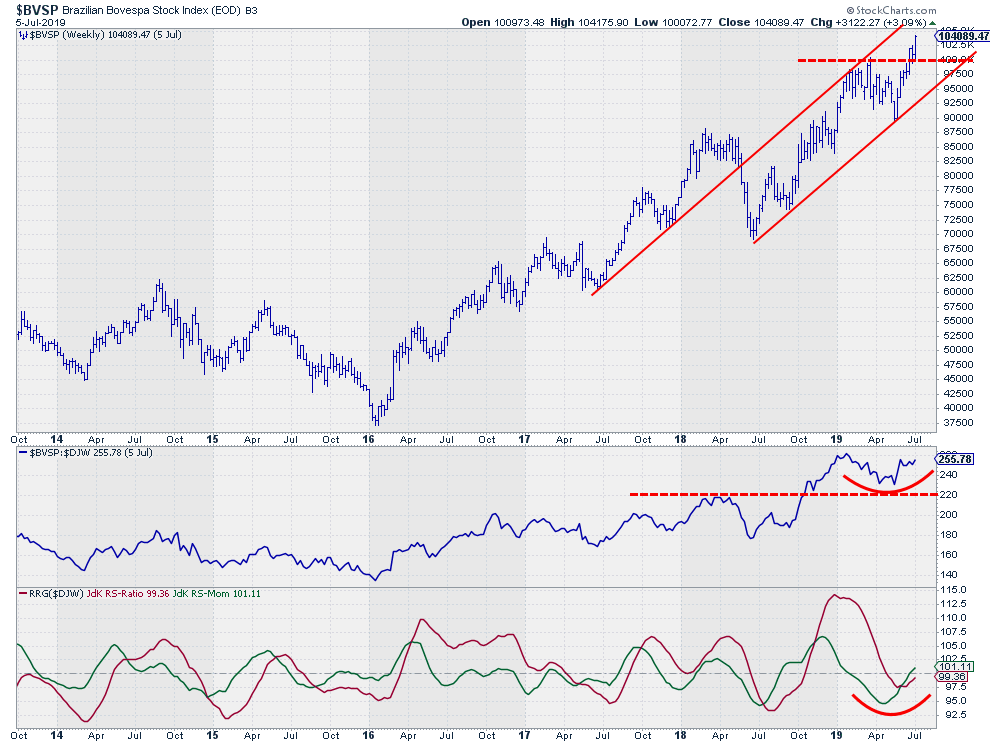 The Brazilian market is just crossing over into the leading quadrant from improving at a strong RRG-Heading. This market seems to have good upward potential in both relative and price terms.
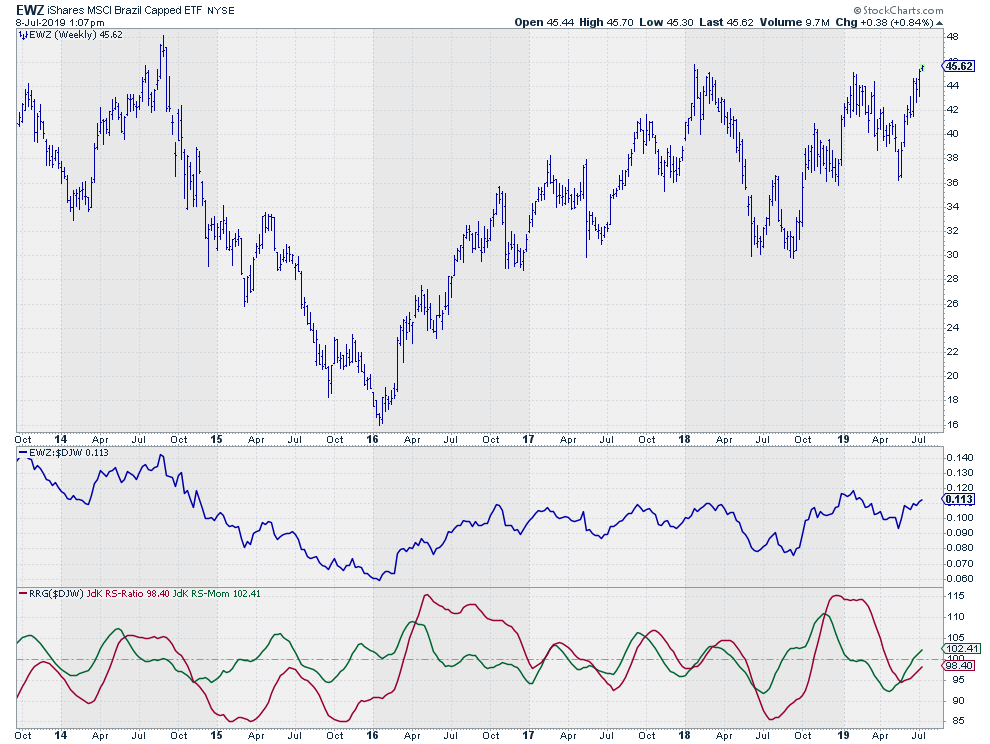
On the price chart, $BVSP broke to new highs three weeks ago, signaling the continuation of the uptrend that is working its way higher inside the rising channel that started mid-2018.
In relative terms, $BVSP broke an important horizontal resistance level in October 2018, which triggered a new relative uptrend versus $DJW. After the initial followthrough after this break, the RS-Line dropped back and found support at the old resistance level.
This dip was a bit too much for the RRG-Lines, as they could not hold up above 100, causing the tail for $BVSP to rotate through weakening into lagging.
The recent improvement has pushed $BVSP through improving in three weeks and is now pushing this market back into the leading quadrant, where it is the market with perhaps the most upward potential.
One way of "playing" this move is through the iShares MSCI Brazil Capped ETF (EWZ). Here is the chart for this ETF. As you can see, it looks quite different from the $BVSP index chart. This is because EWZ is quoted in USD, so the difference between those charts is the BRL/USD exchange rate.
The US
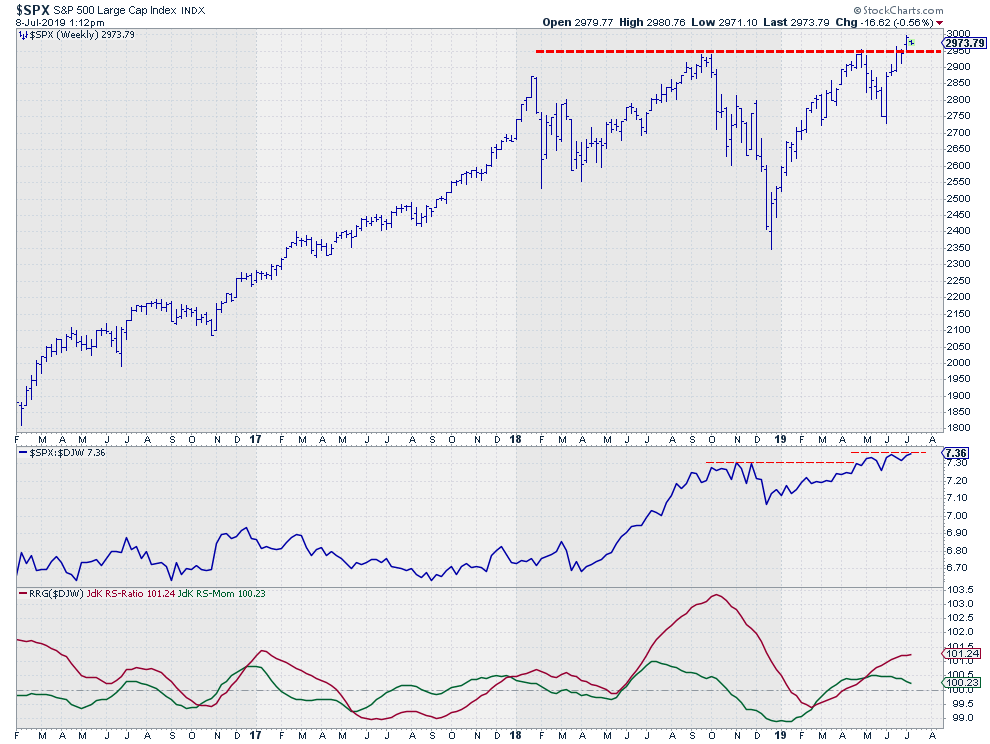 The S&P 500 is breaking out to new highs but, so far, we have not seen the followthrough to make it really comfortable. For me, that is what is really needed to make this a reliable break. The level that I am watching is 2940. As long as $SPX manages to hold above that number, it's okay. When we break back below these previous highs, I will be getting nervous.
In my last ChartWatchers article, "The S&P Just Broke Out of a Two-Year Consolidation, But There are Still Some Pockets of Concern", I have a more in-depth analysis of the S&P and the status of the current break.
From a relative (RRG) perspective, the US market is rolling over inside the leading quadrant versus the DJ Global index and losing relative strength. The uptrend is still there, but it is flattening out and needs new fuel to get going again.
For the time being, it looks like a good idea to have at least some diversification to these foreign markets in a portfolio and not rely too much on the S&P's performance.
If you are a free user of StockCharts.com, the "link to live version" for RRGs will bring you to the free RRG that only shows the major market indexes with limited functionality. For paid subscribers, there is much more functionality and data available on Relative Rotation Graphs, including customization of groups, pre-defined groups, longer history, selection of benchmark, etc.
Let me know what you think of this usage of RRG in the comments below. If you would like to receive a notification when a new RRG Charts blog article is published, simply subscribe with your email address using the form below.
Julius de Kempenaer
Senior Technical Analyst, StockCharts.com
Creator, Relative Rotation Graphs
Founder, RRG Research
Want to stay up to date with the latest market insights from Julius?
– Follow @RRGResearch on Twitter
– Like RRG Research on Facebook
– Follow RRG Research on LinkedIn
– Subscribe to the RRG Charts blog on StockCharts
Feedback, comments or questions are welcome at Juliusdk@stockcharts.com. I cannot promise to respond to each and every message, but I will certainly read them and, where reasonably possible, use the feedback and comments or answer questions.
To discuss RRG with me on S.C.A.N., tag me using the handle Julius_RRG.
RRG, Relative Rotation Graphs, JdK RS-Ratio, and JdK RS-Momentum are registered trademarks of RRG Research.
