
|
This tutorial will show how to add filled boxes to SharpCharts using our annotation tool.
1. Prepare to Annotate a Chart
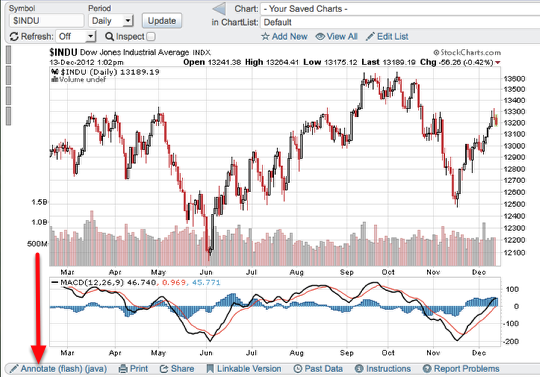
The link for opening the annotation window is located beneath the chart next to "Print." After you click on the "Annotate" link the chart will open in a new window where you can add the filled box.
2. Selecting the Box Tool and Color Preference
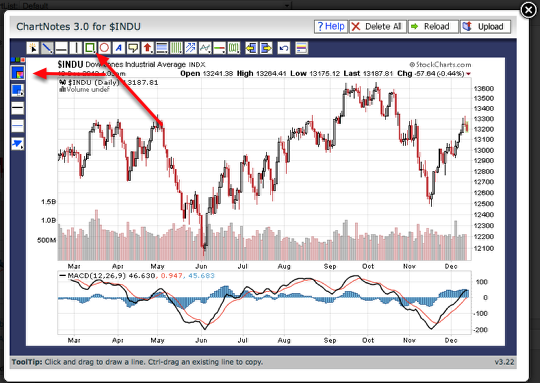
Select the Box icon in the ChartNotes toolbar by clicking on it. You can choose the color you want for the box to be by selecting it from the color palette on the left side.
3. Add the Filled Box
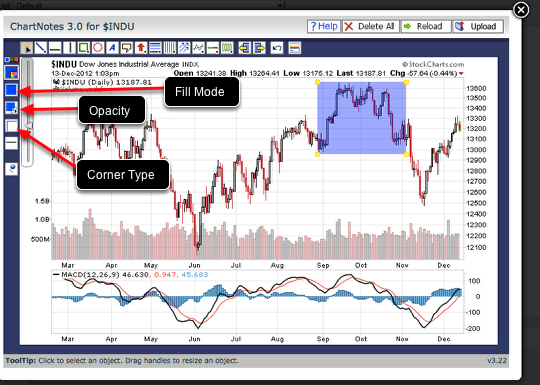
Click and drag on the chart to create the filled box. Subscribers can then upload the chart to their ChartList. If you are not a member, we recommend using a screen capture utility to save annotated charts that you create.
To adjust the opacity of the filled box click the "opacity" icon on the left hand side and use the slider to make the adjustment.
The fill mode can be clicked on to change the fill type of the object. You can select no fill, opacity or solid.
The corner icon on the left hand side allows you change to rounded corners.
A guide for using ChartNotes to add other annotations can be found here.
Posted by: Bill Pendleton December 19, 2012 at 09:45 AM