
MMM Stock Chart Shows A Rounding Top Developing
Topping patterns are critical to recognize prior to the stock turning down, especially in the modern market structure, where HFT algos can trigger sudden price collapses within seconds of the market open. Often times, the new topping formations, which have begun to show up more regularly on stock charts, are not as easy to identify as the Head-and-Shoulders and inverted V- or M-Top formations. The Rounding Top is becoming more widespread, and it is much more difficult to recognize if the technical trader is not looking for this type of top.
3M Company (NYSE: MMM) has a rounding top underway. The rounding shape is harder to see on a daily chart, but it is very visible on a weekly chart or monthly line chart. It is wise to always check the weekly and monthly charts, as well as the daily chart, in order to be certain whether a rounding a top pattern is developing or not.
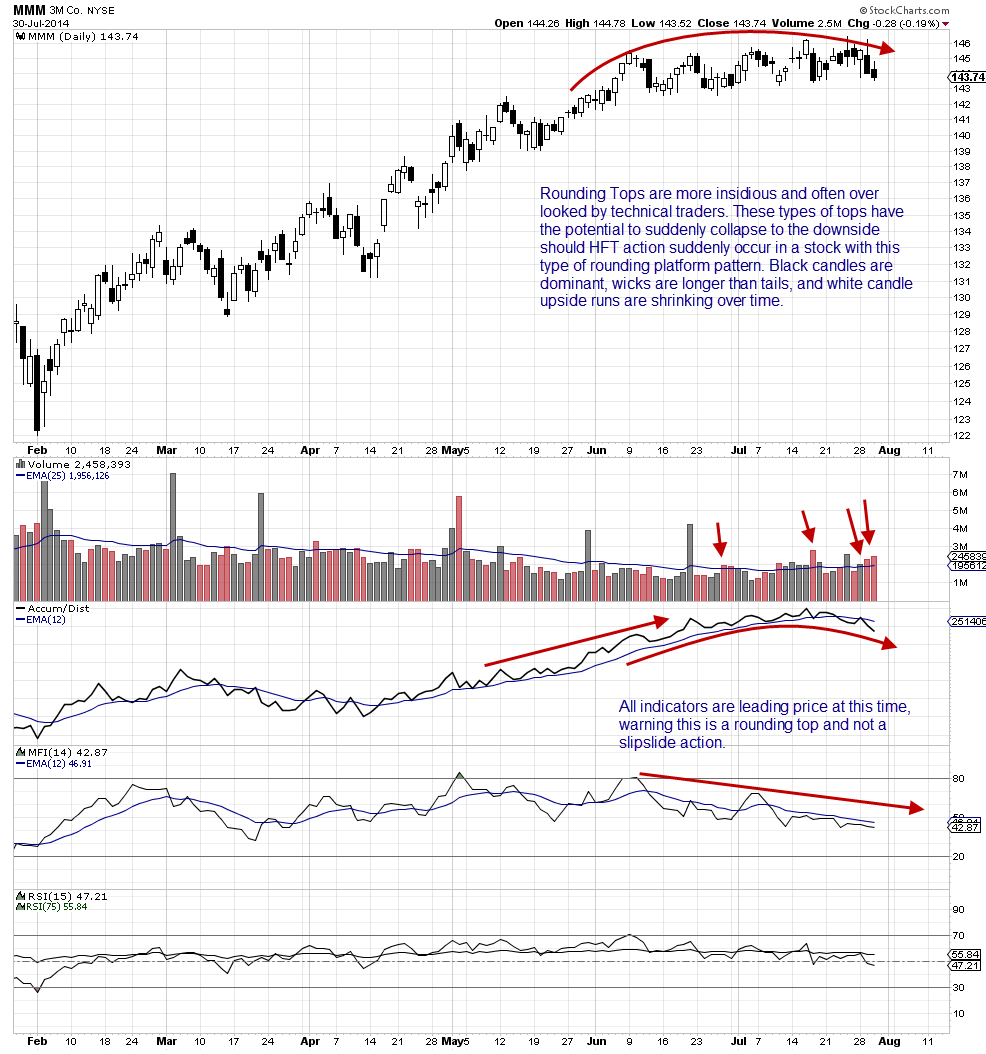
Initially, when MMM is viewed on a daily-chart time frame, the stock appears to be forming a platform pattern in a range between $142-146. The sideways action is tightly compacted, the runs are short, and the stock is holding within the range in a consistent pattern of a few days up followed by a few days down. However, not only do the candlesticks round, as the stock moves into late June and early July, the Accumulation/Distribution indicator is also showing a rounding pattern that leads the stock price. Can you see that in the chart below? Volume downside bars are longer than green upside bars, and Money Flow Index is steadily trending down during this sideways pattern.
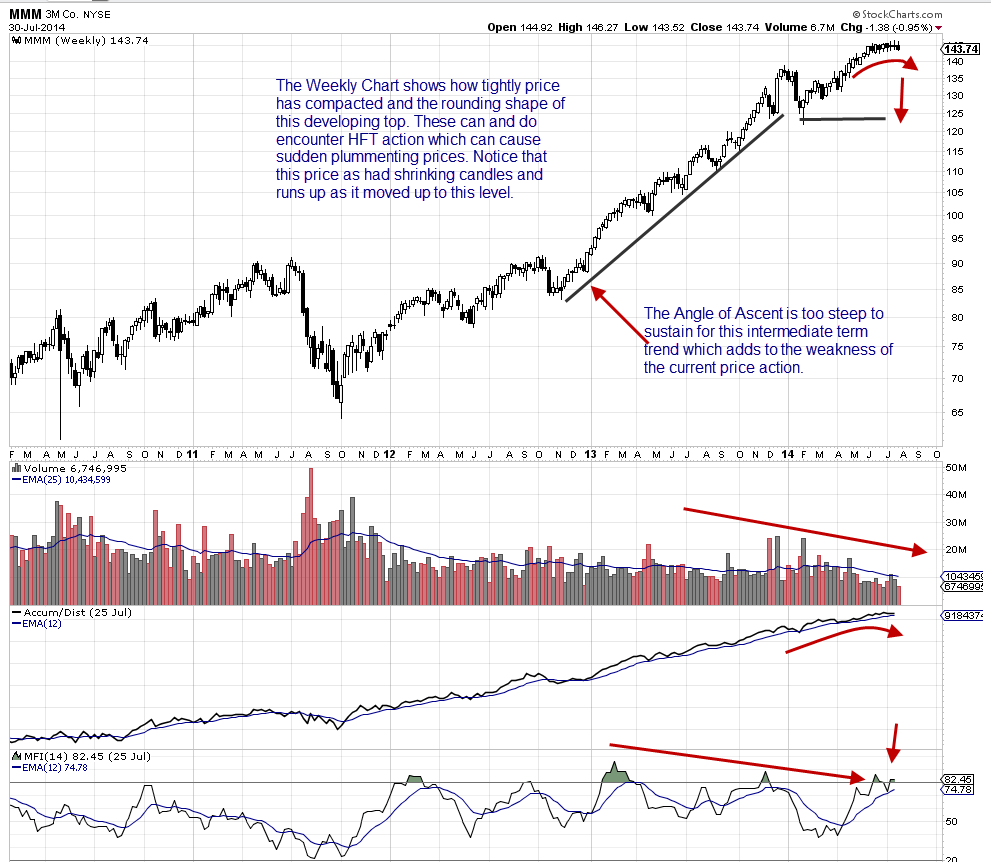
Above, the chart of MMM is a weekly chart, and the rounding of the top formation is far easier to see. The Angle of Ascent is too steep to sustain and an initial inverted U-Top formed, but uninformed “buy-on-the-dip” investors moved in, as the stock hit the neckline and moved price upward. These are smaller-lot investors, retail traders, and odd-lot investors buying small-share lots. At the same time, institutions are rotating out of this stock, allowing the price to rise, as they use specific order types to sell into rising price action. The pressure from large lots selling while smaller lots buy are buying overwhelms the buyers, and the rounding top is the result of this opposing large-lot to small-lot price action.
Volume, Accumulation/Distribution, and Money Flow Index patterns are consistent with large lots, aka Dark Pools, selling while smaller-lot investors and retail traders are buying. This pattern is one reason why using “buy-on-the-dip” strategies can be higher-risk, especially when a prior inverted V-, M-, or U-Top formation has formed and the stock drops to that neckline support level. Buying at this level creates the risk of Dark Pools selling against the stream of buy-on dippers from the retail crowd. This is most common during portfolio-adjustment months, where the giant and large institutions are rotating out of or lowering held shares of some stocks while buying into other stocks.
Summary:
The traditional topping formations are important to learn and identify, and they are usually quite obvious IF you know what to look for. However, it is also critical to learn to identify the newer tops which form due to the new types of venues and specialized orders in the market, which are used by Dark Pools and other professionals, who control price in such a way that the topping action is not as easily seen.
Always include quantity and large-lot tracking indicators, which reveal Dark Pool activity, in order to see these leading patterns early on in a top formation.
Trade Wisely,
Martha Stokes CMT
www.TechniTrader.com
info@technitrader.com