
How to Identify High Frequency Trading Action for Reversal Patterns
There has been a deluge of articles, commentaries, and debates about High Frequency Trading action. Technical Traders can learn to use HFT action to their advantage. Often times, if an HFT footprint appears on a stock chart, a technical trader can set up to watch the stock for future huge runs or gaps, entering before the HFT action, and thereby front-running the HFTs.
The first step to using HFTs as an advantage for technical trading is to learn to identify their footprints on the charts. HFTs leave a distinct pattern that is easy to recognize.
Below is the daily chart for Symantec Corp, SYMC, which is the stock chosen for this lesson as an example to study.
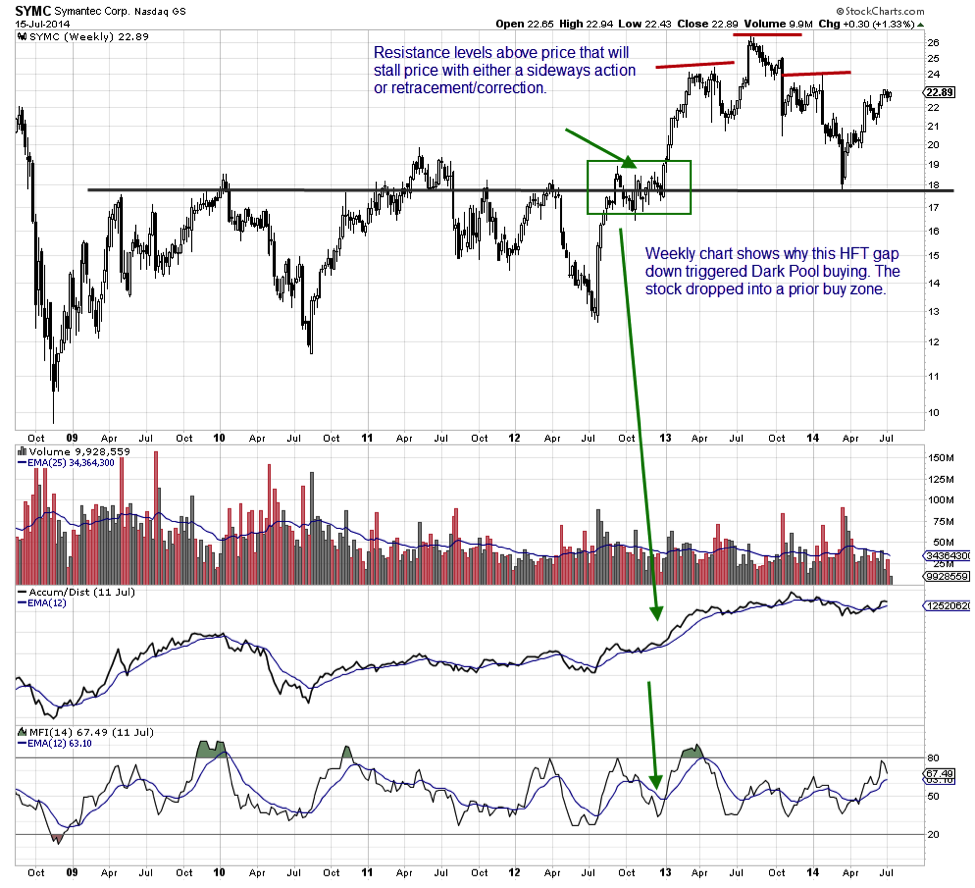
SYMC is on the cusp of completing a bottom formation from a correction that started nearly a year ago. This bottom is precise and well developed with HFT action that created the final low. Often HFT gap-downs are the final sell-off that triggers Dark Pool giant-lot buyers whose entry starts the bottom formation. Bottoms that are this precise and clearly defined have lower risk and are well suited for both beginners and more advanced technical traders. The HFT gap down on March 21, 2014 was the final low as the stock reentered the prior buy zone of Dark Pools from 2012. Controlled Dark Pool and other custom Alternative Transaction System orders for giant lots triggered the next day, driving price up back to the February levels. Dark Pool quiet accumulation contained the stock price through early May when the stock moved up again on mild swing-style action. It is currently forming a compression pattern at the resistance level of the bottom completion area.
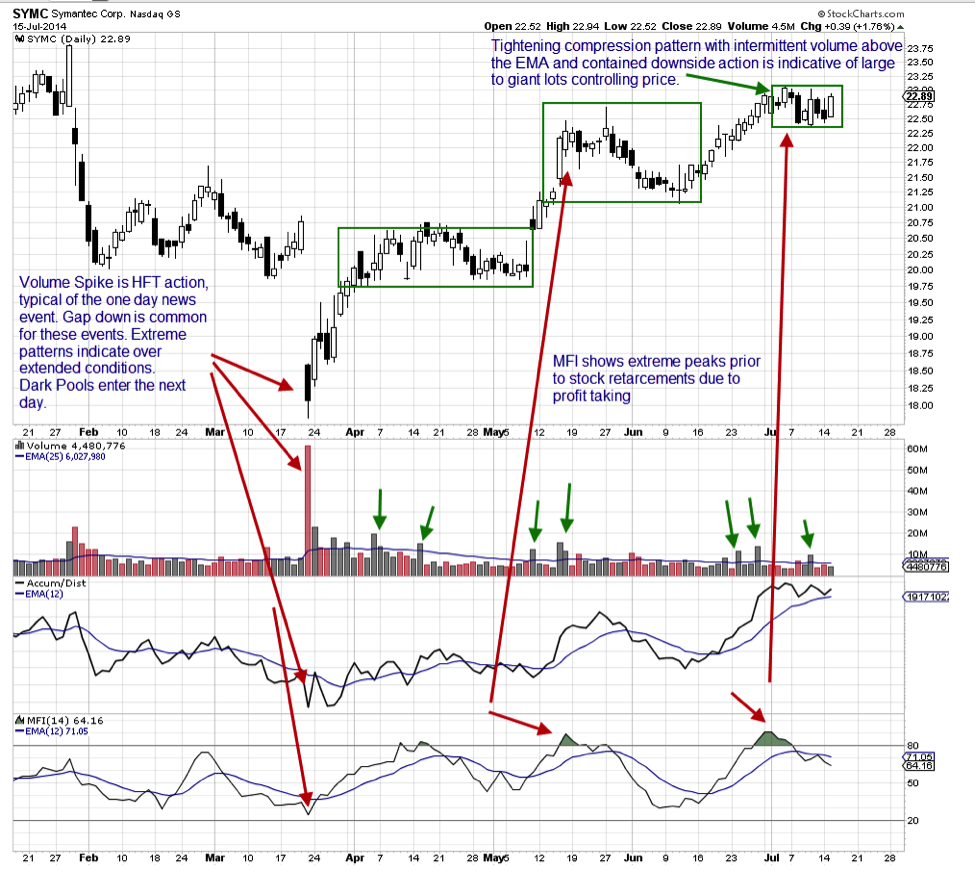
Whenever a stock price compresses this uniformly and precisely, Dark Pools are controlling price, maintaining it within a specific zone. Volume, accumulation/ distribution, and money flow confirm quiet accumulation at the current price range. Downside volume drops well below the volume bars’ average. Money Flow Index has peaked twice, indicating a minor retracement due to profit-taking on short-term professional trades. This retracement has not been able to sell down as much as the prior consolidation, however, as buy side pressure holds the stock in a tight consolidation formation.
Summary:
HFTs frequently create the final low for a stock unwittingly. Since HFTs strictly use computer-generated sell orders and buy orders, the algorithm is not capable of discerning support or resistance levels, buy zones of the Dark Pools, or extreme price and volume conditions. Technical traders who are able to recognize these patterns have a decided advantage over the HFTs.
Trade Wisely,
Martha Stokes CMT
www.TechniTrader.com
info@technitrader.com