
Monitoring purposes SPX: Neutral
Monitoring purposes GOLD: Gold ETF GLD long at 173.59 on 9/21/11
Long Term Trend monitor purposes: Flat
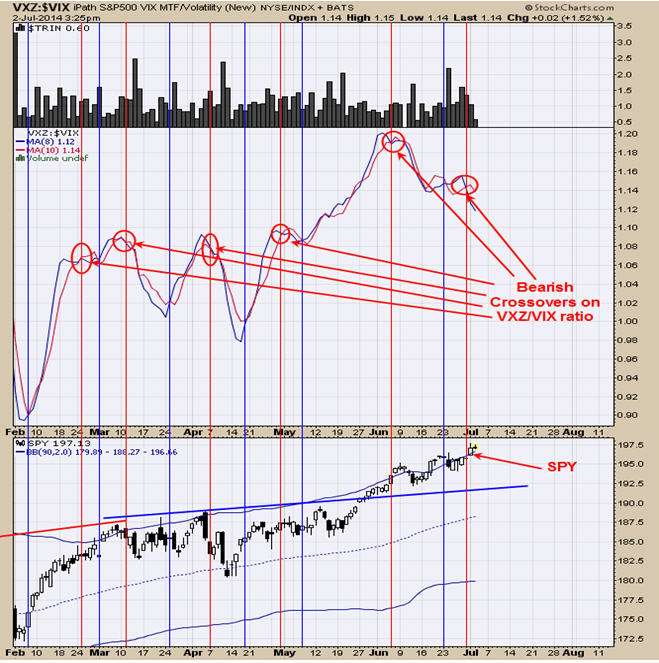
We have shown this chart in the past which is the VXZ/VIX ratio. The VXZ is the medium term vix and the VIX is the new version for the Volatility index. This ratio helps to find the trend for the SPY. We have circled in red where the VXZ/VIX ratio produced a bearish crossover to its 10 period moving average and in most cases the signals have been timely. We also notice that the bullish crossovers for this ratio (blue vertical lines) produced better results. However the current bearish crossover is a warning sign for the current uptrend in the SPY.
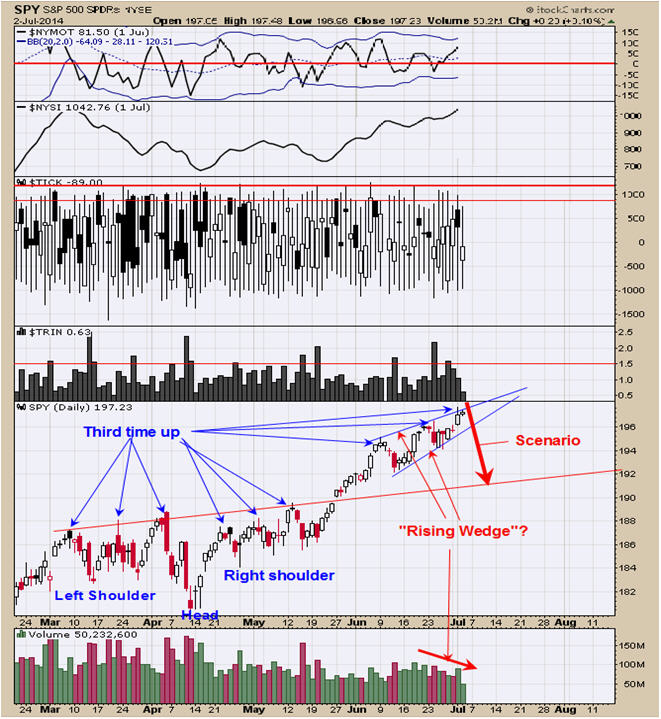
The pattern that could be forming here is a bearish “Rising Wedge”. Volume has been dropping as it nears the July 4 holiday and that what happens in a “Rising Wedge” pattern. A “Rising Wedge” pattern has a downside target to where they began which in this case would be a target near 192 which is also near where the Neckline of the Head and Shoulders lies and a support area. On the chart above we marked a pattern called “Third time up” which is just that, where a market makes three higher highs. Normally after the third top the market experiences a pull back. This scenario would go well with the “Rising Wedge” pattern which also expects a pull back. Staying neutral for now.
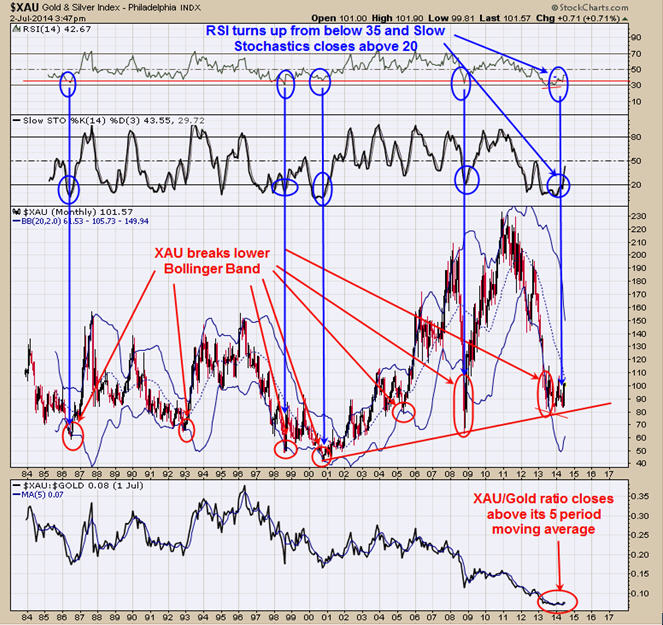
This is the monthly chart of the XAU along with its RSI and Slow Stochastics going back to 1984. Bullish signals are generated for the XAU when the monthly RSI turns up from below 35 and the Slow Stochastics reached below 20 and than closes above 20. These signals are identified with blue arrows. It hard to see on this chart but the Slow Stochastics closed above 20 and the XAU/Gold ratio closed above its moving average and along with the RSI closing above 35 on the close of June, all of which triggered a buy signal on this monthly chart. Also notice that the XAU broke its lower Bollinger Band (circled in red) at major lows. The last time the lower Bollinger Band was broke was at the June 2013 low. We have cycle due at the end of July to early August where XAU may build a trading range until then. We have support now near 24.50 area on GDX and will be watching that area for a potential bullish setup. The low in GDX appears to have formed at the December 2013 low near 20.
Tim Ord
Editor
www.ord-oracle.com