
Monitoring purposes SPX: Sold long SPX on 8/14/14 at 1955.18 = gain 2.39%. Long SPY on 8/7/14 at 1909.57.
Monitoring purposes GOLD: Gold ETF GLD long at 173.59 on 9/21/11
Long Term Trend monitor purposes: Flat
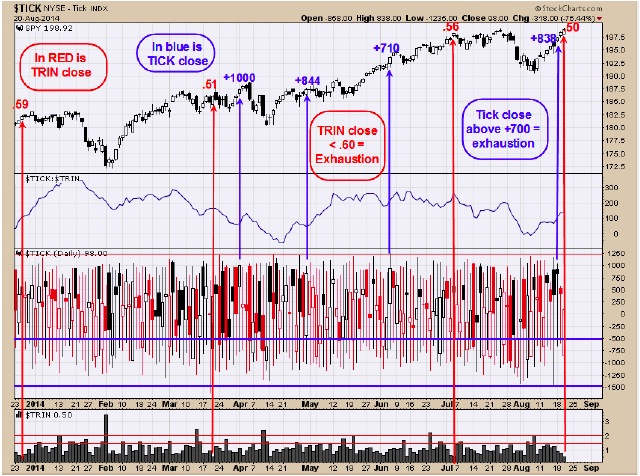
Above is the tick trin chart for the NYSE and the top window is the SPY chart. This chart goes back to late December 2013 and shows the times (marked with blue arrows) when the Tick index closed greater than +700 which is a rare occurrence. As you can see when the Ticks closed above +700 in all cases a pull back was evident within two days. On Monday the Ticks closed at +838 and suggest a short term high may have been reached today. Also on this chart labeled in red is when the TRIN closes less than .60 which is also a rare occurrence. After a rally in the market a TRIN close below .60 have been a short term bearish sign for the market. We are looking for a minor pull back here that may find support near 196 range on the SPY. The TRIN and TICK close suggests a pull back is coming. This potential pull back should lead to another buy signal according to the chart on page two. Sold long SPX on 8/14/14 at 1955.18 = gain 2.39%. Long SPY on 8/7/14 at 1909.57.
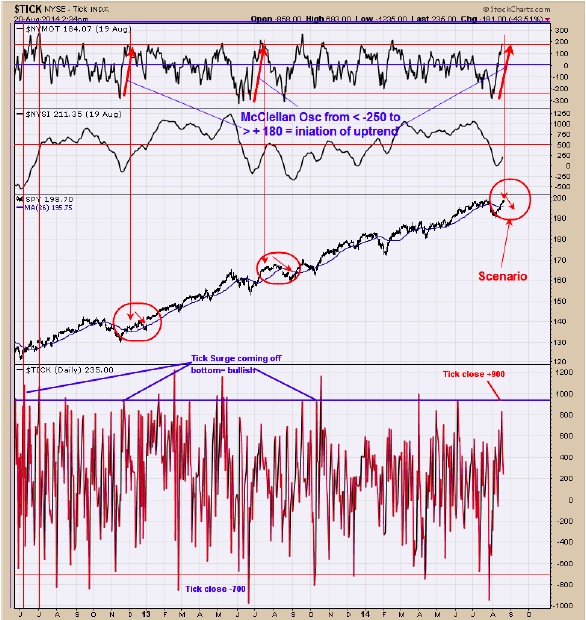
The chart above goes back two year and 3 months. The top window is the McClellan Oscillator. Its an intermediate term bullish sign for the SPX when the McClellan Oscillator trades below – 250 and then immediately rallies to > +180. This condition implies an Iniation of an up-move in the market. After this surge from extreme negative to extreme positive in the McClellan Oscillator a lull in the market is expected before heading higher later. We have lots of example of this condition going back further than two years but the chart gets messy showing all the examples so the examples above will have to do. Therefore we are still expecting a consolidation over the next couple of weeks but after the consolidation is completed, new highs are expected. We will be looking for a bullish setup on the next pull back. Back on the sidelines for now. Sold long SPX on 8/14/14 at 1955.18 = gain 2.39%.
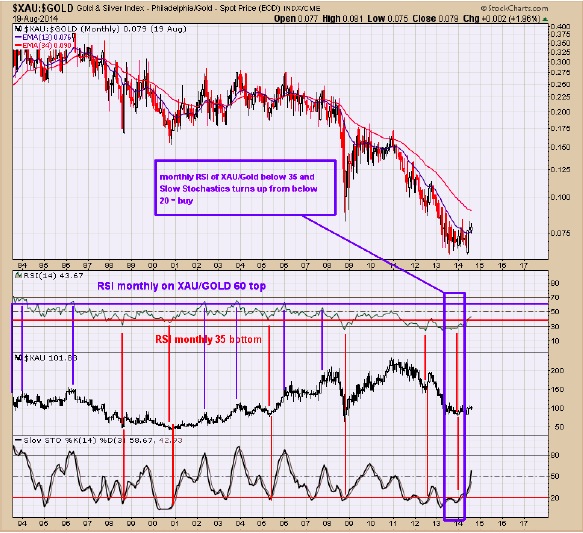
Commercials last week have increased their bearish slant on the latest COT report and a short term negative. However the bigger picture is bullish and a multi month if not multi year rally has started for gold stocks. The chart above is the monthly XAU/Gold ratio going back to mid 1993. When this ratio is rising than gold Stocks is outperforming gold and a bullish condition for both gold stocks and gold. When this ratio is falling than that is a bearish condition for both gold stocks and gold. The monthly RSI and monthly Slow Stochastics are on the XAU/Gold ratio. When both the monthly RSI of the XAU/Gold ratio turns up from below 35 and the Slow Stochastics turns up from below 20 a bullish long term signal is triggered for both gold stocks and gold. We have labeled the bullish triggers with red vertical lines. The most recent signal came in January of this year and remains on a bullish signal. The Commercial COT does suggest a short term pull back and we will wait for better evidence on a bullish signal short term.
Tim Ord
Editor
www.ord-oracle.com
For 30 day free trial send your email address to Tim@ord-oracle.com.