
 Hello everyone! Talk about the deepest equity market correction since Spring 2012 and it raises three questions: is it the beginning of the end of the 2009-2014 Bull market?, where will this yet secondary correction find support? what can be expected from the current bounce? Three different perspectives for three different investment or trading horizons. Yet, all of them interplay. Considering all three, puts the market into perspective.
Hence, at Fingraphs.com, we present all charts over 3 time horizons “Markets in 3D”, thereby providing an at a glance view of how potential trends interplay. We like to say that we are revisiting Charles Dow 2nd basic principle: “The market has three trends – primary, secondary and minor trends”. Each chart is then analysed with simple and visual indicators: 1. Bull and Bear figurines for potential Trend direction (Trend), 2. green and red estimated price projections (Targets) and 3. OverBought/OverSold as well as Market Stress indications (Risk). ‘Markets in 3D’ and these straightforward tools is what we aim to bring you in regular contributions to come.
Sounds simplistic, I’d say we focus on the Essentials (Trends, Targets, Risk). So what’s our background? Let me introduce it over the following paragraph. Founded in Geneva, Switzerland, by my father Edouard, our company Management Joint Trust SA has been providing technical analysis institutional advisory services since 1969. The system was computerized in the early 80s and by 1984, a first on-line charts platform was launched, sending colour Intraday charts to the likes of Singapore in less than 10 seconds. Prior to that, my grandfather Forbes Pennycook wrote a book yet to be published on price/volume set-up cases as he headed up the local Santa Fe, New Mexico (USA) brokerage firm Quinn & CO during the 70s. So, I represent the third generation of technical analysts in the family. My name is Jean-François (J-F) Owczarczak, I’m 41 years old. After graduating in Business from the University of St Gallen and 5 years in investment banking, I joined the family business in 2003. I’m a certified risk manager (FRM) and technical analyst (CFTe). On this last certification, I received the Bronwen Wood award for the best exam paper written in the world that year (2012). I act as Chief Investment and Business Development Officer for the company. Our historical business focuses on large institutional clients in Europe. We provide tactical and strategic asset allocation advice based on our own proprietary technical analysis 3T methodology (Trends, Targets and Timing). In 2012, we created FinGraphs.com, a streamlined yet more intuitive version of our institutional methodology. It is tailored for on-line distribution, is priced accordingly, but retains so much of our value-added. More focused on trends, it capitalises on the ‘Markets in 3D’ visual effect to deliver an at a glance analysis of any instrument. FinGraphs will be the basis for our contributions (we cover Equities, Indexes, ETFs, FX, Interest rates, Commodities - Long term to Intraday).
Now, let’s turn to the markets started with our Investor’s View on the S&P500 Index. An Investor’s View is a combination of a Weekly, a Daily and an Hourly chart (we also have Trader’s Views for shorter term traders and Scalper’s Views for Intraday market participants). It will help us answer the three questions above. I hope you enjoy our colourful charts.
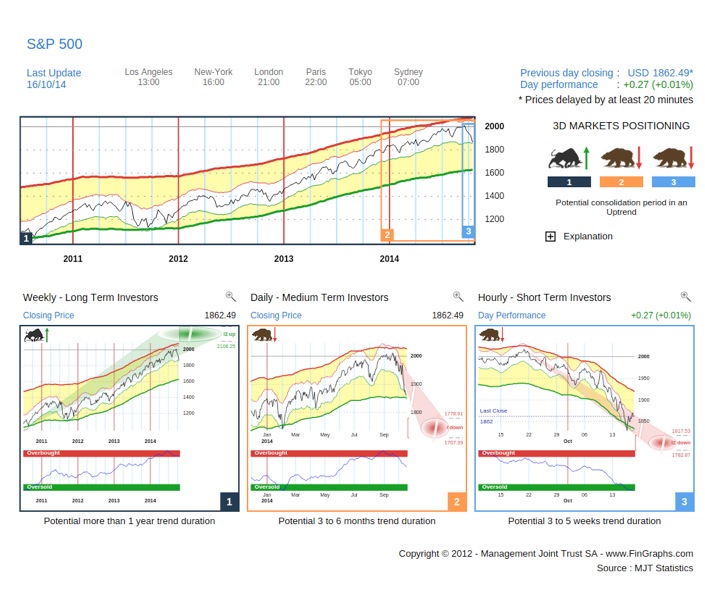
At first glance our 3D Markets Positioning Box (top right corner of the chart) positions the S&P500 in a “Potential consolidation period in an Uptrend”. This is the case when the Long Term trend is still potentially heading up, when both the medium and short term trends are potentially heading down. The summary charts above puts the frequencies into perspective. The three time boxes below focus on each frequency (LT: weekly, MT: daily, ST: hourly).
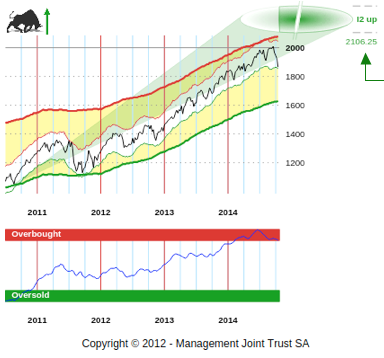 Let’s zoom in on the Weekly chart: the potential trends over the next Quarters is still in a Bull. The estimated price targets are heading towards Impulsive 2 territory (green arrow), i.e. we differentiate between Corrective, Impulsive and Impulsive 2 targets (Up or Down). For each level, we factor the width of our larger yellow standard deviation envelope (our measure of historical volatility) by either Corrective, Impulsive or Impulsive 2 factors. We then add the result to the MIN (or subtract from the MAX) of the chart to obtain our target zones. Impulsive 2 can be found in very extended moves when risk/reward is stretched. Yet, the long term trend is still potentially heading up.
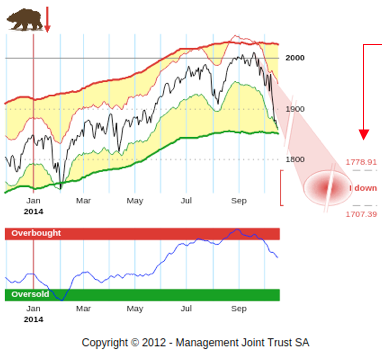 Now turning to the Daily chart: it defines the trend over the next months. It broke down last Monday into an Impulsive down move (red arrow), i.e. price moved below Corrective targets to activate Impulsive down targets. This is the first time, this has happened on the S&P500 since the correction which took place during 2011 (in Spring 2012 although the percentage price move was higher, a higher historical volatility at the time prevented it from breaking Corrective targets down). Impulsive breakouts often, not always, fulfil their targets (they did in 2011). This event should at least take any medium term investor out of complacency. Estimated targets over the next few months: 1779-1707.
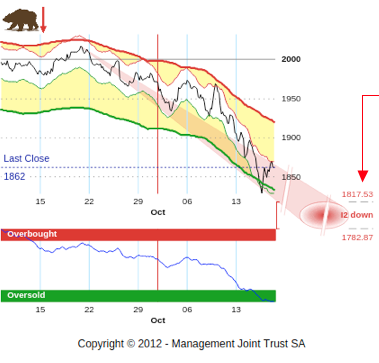 On our Hourly chart, the current Bear trend has fulfilled Impulsive targets down and is now heading towards Impulsive 2 estimated Targets (red arrow). The Hourly charts define the trend over the next weeks. Our Risk Index is well Oversold (lower green band) and our thinner white envelope is hitting against our larger yellow one to the downside. This is what we call Market Stress. In a strong descending trend, it often results in temporary corrections up. So, the potential trend is a bit extended (Market Stress and Impulsive 2), but still heading lower. We would expect further downside over next few weeks.
So back to our three questions above: although extended, there are no indications yet that the Bull market in place since 2009 has ended with the current sell-off. Medium term, however, this correction has recently turned impulsive down, possibly into an intermediate downtrend. Estimated targets point to lower levels between 1779-1707 over the next few months. These levels did already provide support last January. They are also close to the tops seen during the irregular correction in Q3 last year. Finally, the current short term bounce should experience headwind from a strong descending Hourly trend, we believe there is more downside potential over the coming weeks.
For more on our methodology click here and then visit the ‘About Us/Press release’ and ‘User Guide’ sections of our website. Clicking that link also qualifies you for a 7 day demo and a 10% discount on our services if you choose to subscribe.
Have a great weekend!
J-F Owczarczak (@fingraphs)