
Monitoring purposes SPX: Sold 9/30/14 at 1972.29= gain .003%; Long SPX on 9/25/14 at 1965.99.
Monitoring purposes GOLD: Gold ETF GLD long at 173.59 on 9/21/11
Long Term Trend monitor purposes: Flat
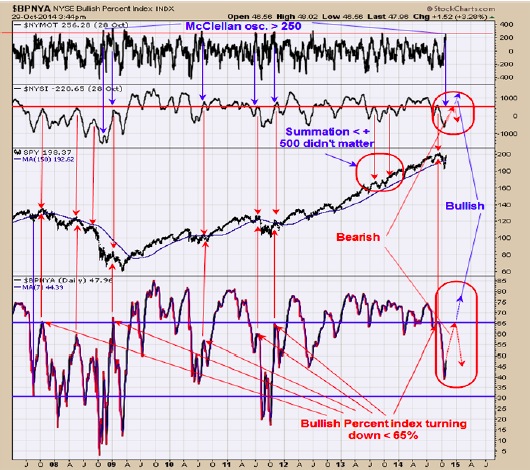
The chart above goes back to mid 2007. The bottom window is the Bullish percent index for the NYSE. It has been common for the SPY to have strong declines when the Bullish Percent index turned down less than 65% stocks are on Point and Figure buy signal. This condition appeared at the September top. It also has been a bearish condition for the market when the McClellan Summation index turned down from less than +500. The last top in September the McClellan Summation index reached +584 and evidently that was close enough as September top produced a decent decline. What to watch for now will be how high the Bullish percent index reaches as well as the McClellan Summation index on the current rallies phase. If the Bullish Percent index turns down before reaching into the 65% range and the McClellan Summation index turns down near +500 or lower, the signs for a significant top will be present. The top chart is the McClellan Oscillator and we have marked times when this indicator reached above +250 (Yesterday reading reached +256) that corresponded with times the Bullish percent index came in < 65% and Summation index top < +500. Which such a strong McClellan Oscillator near +250, some of the decline were still significant.
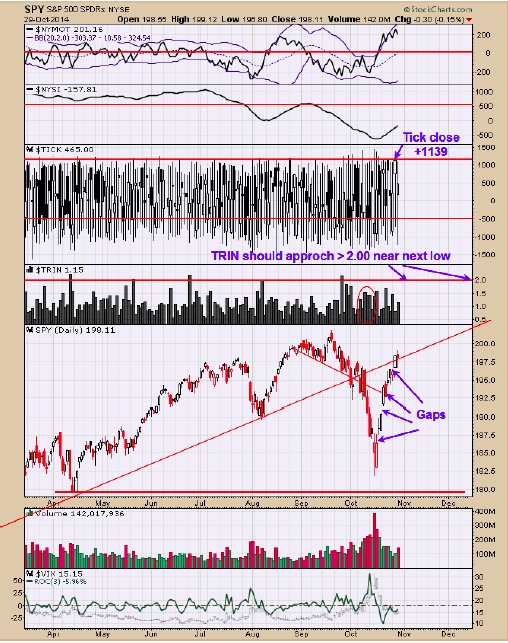
Yesterday and today the SPY run into the trend line connecting the lows going back to the July and appears to be providing resistance. The short term picture for the market is exhaustion where the McClellan Oscillator reached +256 and the TICK close yesterday of +1139 and the rally up from the October 15 low produced four gaps. Our TICK/TRIN ratio we have been showing since October 20 predict a sideways market that could last several weeks. We will see what develops on the FOMC meeting tomorrow. The next pull back should produce a TRIN close above 2.00 to suggests a bottom is near. We are staying flat for now/
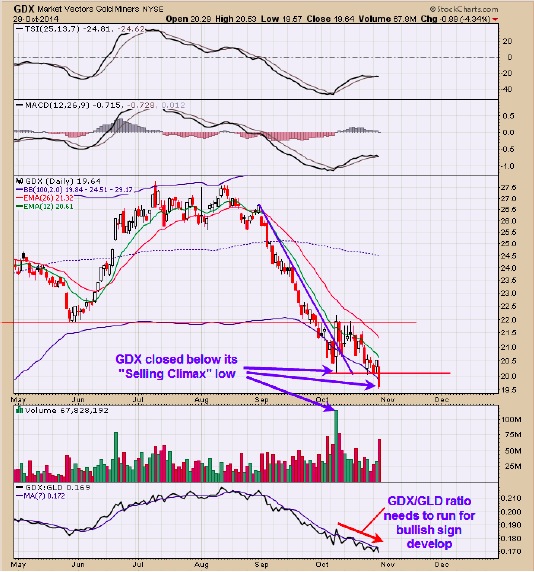
The monthly signs for gold and gold stocks are showing bullish conditions and there may still be a low near current levels. For short term GDX closed below the “Selling Climax” low of October 8 and the GDX/GLD ratio continued lower all of which is short term bearish and we close out our long GDX position. With the COT commercials bullish on the Euro and Gold and Bearish on the US dollar a bottom may not be far off. Also Seasonality turns back to bullish for November. We will remain neutral for now.
Sold long GDX on 10/29/14 at 19.65 = loss 8.5%; long GDX at 21.47 on 10/14/15.
Tim Ord,
Editor
www.ord-oracle.com
tim@ord-oracle.com