
We set out today to understand to which extent falling EUR/USD may be helping Germany, Europe’s largest exporting economy and especially if we can register any effect of it through the performance of the DAX Index. To do so, we will make the broad assumption that the DAX index reflects anticipations in respect to the German economy (i.e. we will stick to what we can chart).
The discussion seems particularly timely with the QE3 program having just ended in the US and with the Eurozone currently implementing its own QE program as an attempt to kick-start its sluggish economy. It is also set against a background of massive recent underperformance by European equity market indices (and the DAX especially) versus their North American counterparts (both in local currency and in USD terms).
Common sense would probably support the fact that anticipation of monetary easing in Europe should have a positive impact on the German stock market (and its exporters). In EUR denominated terms at least, this should help European indices regain some of their underperformance.
We will see that not only this is not the case yet, but that the underperformance is likely to continue. It is hence much too early to go bargain hunting into the Eurozone.
We will first look at both markets separately using the FinGraphs methodology.
We will then view the relative chart of the DAX vs SPY in USD dollar terms.
We will then strip out the EUR/USD effect and compare both indices with a hedged ratio of their relative performance.
Finally, we will note that over the last few years, this hedged ratio has had extraordinary anticipative value for the future developments of the EUR/USD exchange rate and that European markets first need to start out-performing in local currency terms before a like to like out-performance (i.e. same currency basis) can even be considered.
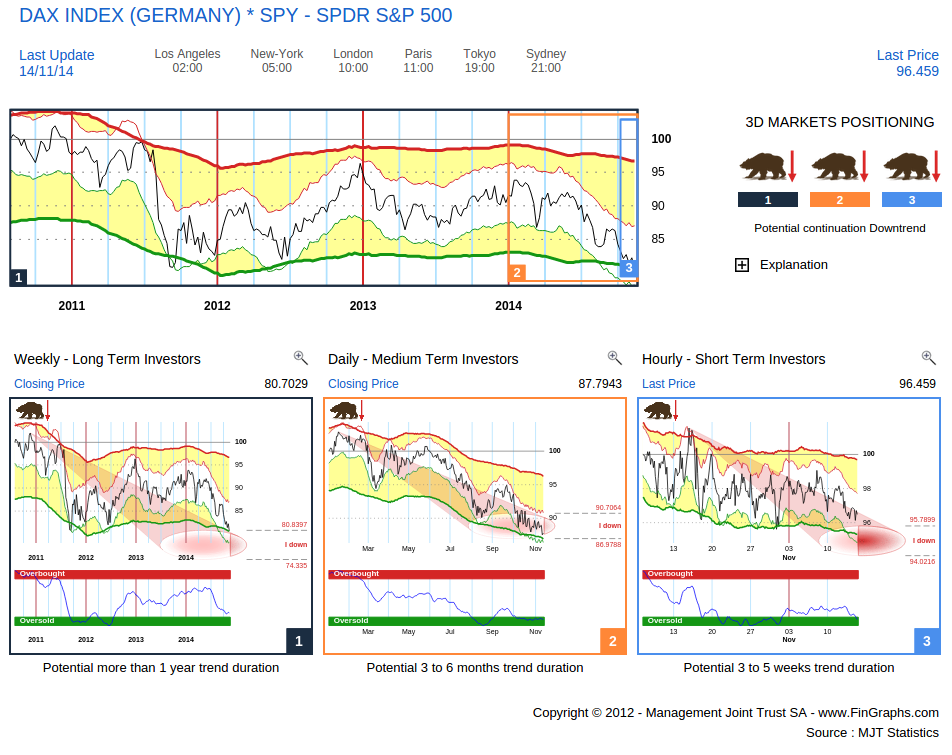
Let us first consider the Investor’s View of the DAX ( a combination of a FinGraphs’ Weekly, Daily and Hourly chart):
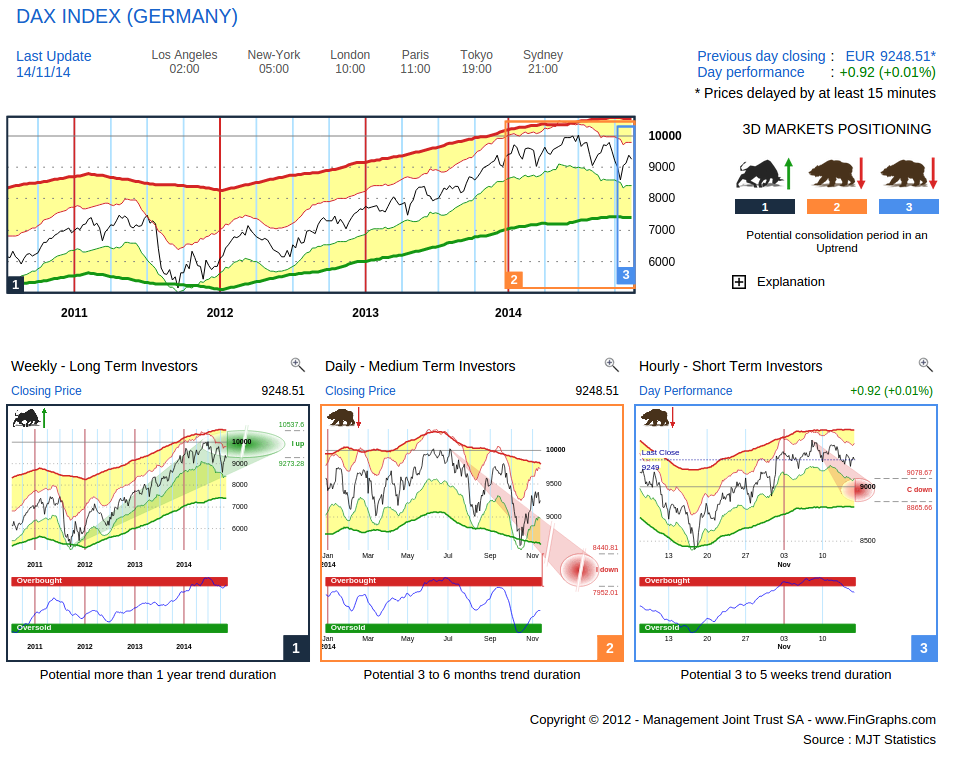
The message (One Bull and Two Bears) is labelled “a Potential consolidation period in an Uptrend”. This would confirm our view that European markets are still, and despite the recent rally, in a strong secondary correction down. Indeed, although the Weekly (left hand chart) is still in an uptrend (“Bull”), both the Daily (middle chart) and the Hourly (right hand chart) are trending lower (“Bears”). Risk/Reward is also at a disadvantage with the Weekly having reached its targets up (green oval) and the Daily (perspective over the next months) still showing some downside potential (red oval). The Hourly (perspective over the next weeks) has recently turned down in what is for now just a correction (C Down). A stronger resume downtrend signal would materialize if prices were to break below these corrective targets down (red oval) or below circa 8’865 (not the case yet).
The Investor’s View of SPY does however show a much stronger story, confirming the relative strength of US vs European equity markets:
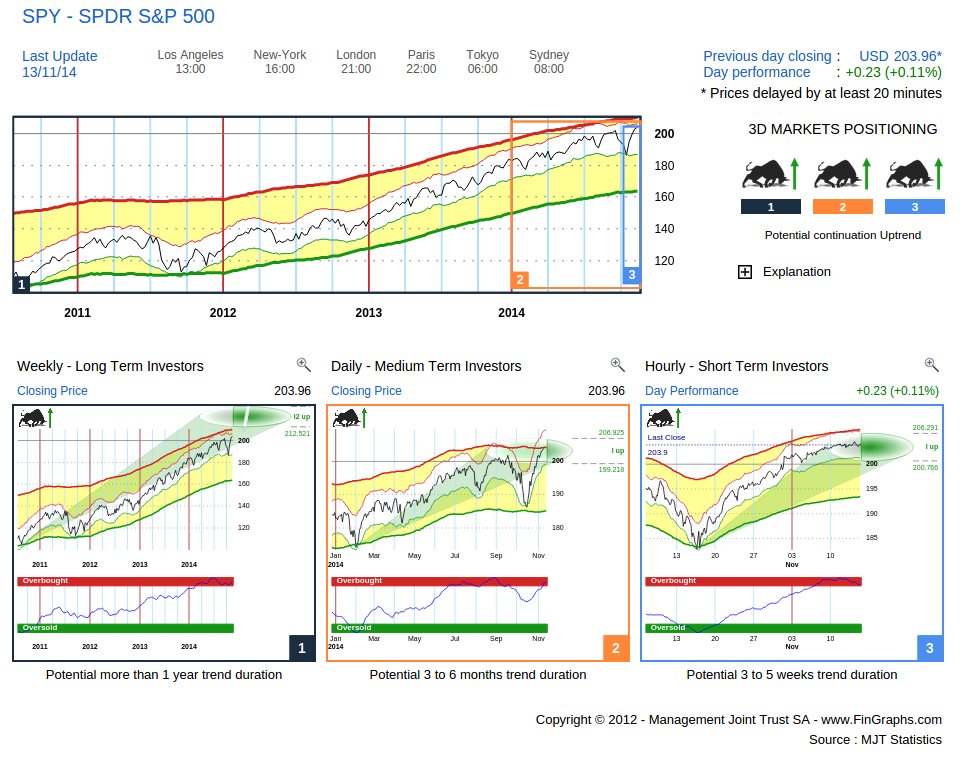
All three trends are back in a “Bull” (labelled “Potential continuation Uptrend”), and although the Daily and Hourly charts have for now reached their targets (medium and short term exhaustion), the Weekly charts still shows some potential into next year. It is impressive to consider how resilient the latest Hourly Uptrend has been.
Now let’s have a closer look at the relative perspective, first in USD terms with this Investor’s View of the DAX vs the SPY.
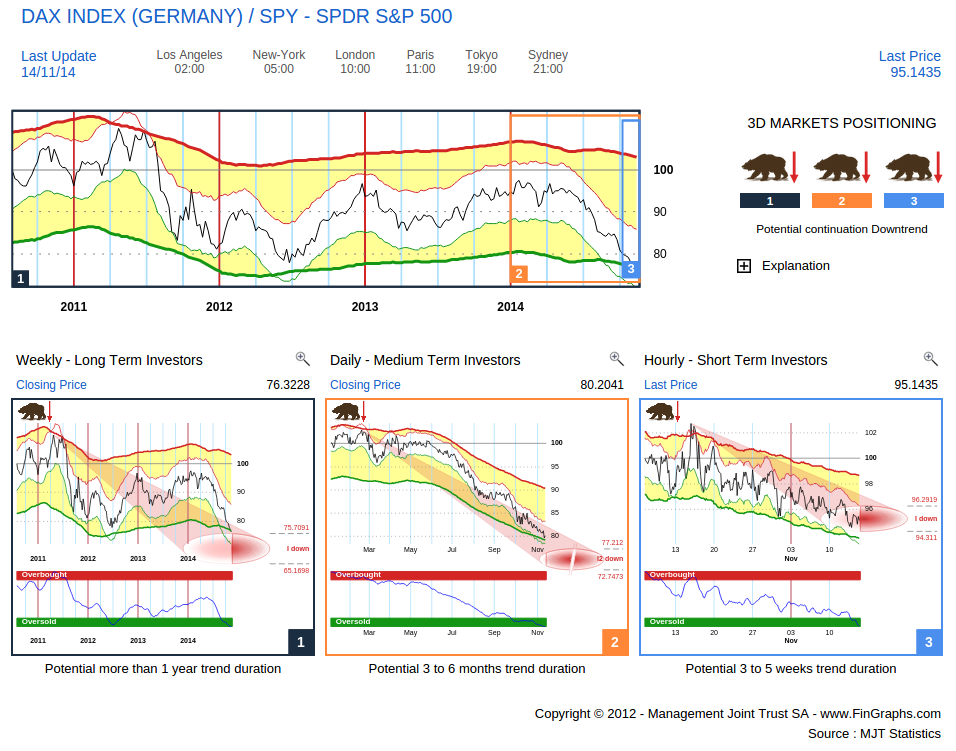
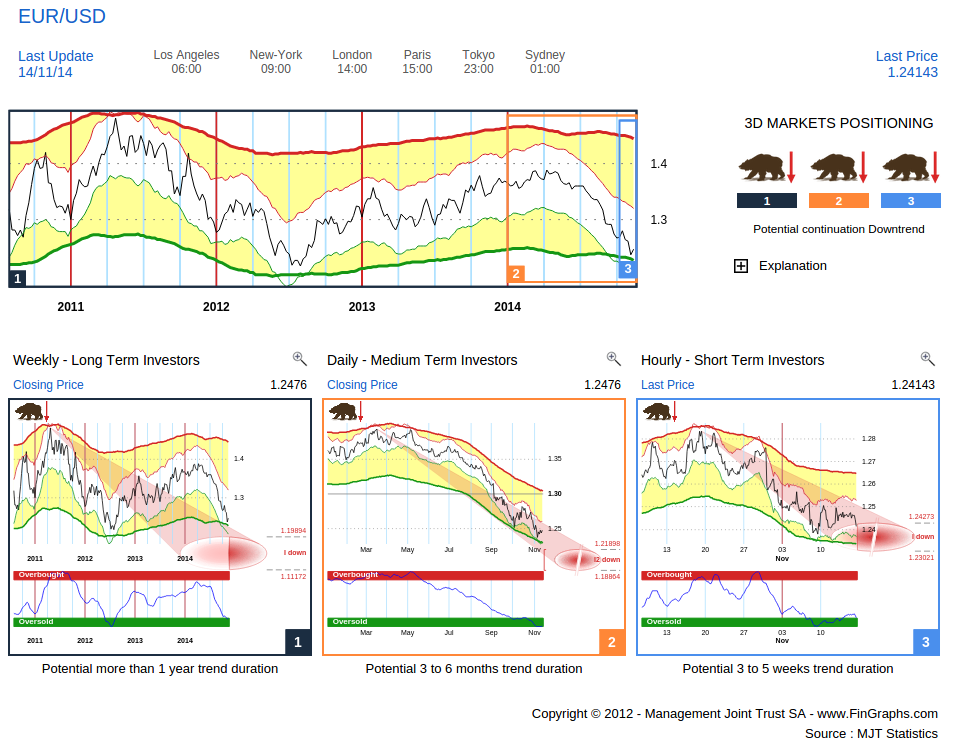
All three trends are heading down, both the Weekly and the Daily still show more downside potential over respectively the next few quarters and the next few months. This chart is however heavily influenced by the EUR/USD picture for which we include the Investor’s View below (it confirms our comments last week that the dollar over the medium to long term still has potential, in EUR/USD term, possibly well below 1.20 over the next few quarters).
Now let’s strip out the currency effect and compare the DAX to the SPY on a hedged basis with the following Investor’s View (a simple ratio between DAX and SPY):
Although the Daily (middle chart) does seem a bit exhausted (within the red oval), the Weekly (left hand chart) still anticipates further underperformance even when the currency effect is stripped out.
It is also very interesting to note that over the last few years, this hedged ratio has had extraordinary anticipative value for the future developments of the EUR/USD exchange rate. We have superimposed both in the Weekly charts below (EURUSD and DAX vs SPY hedged ratio):
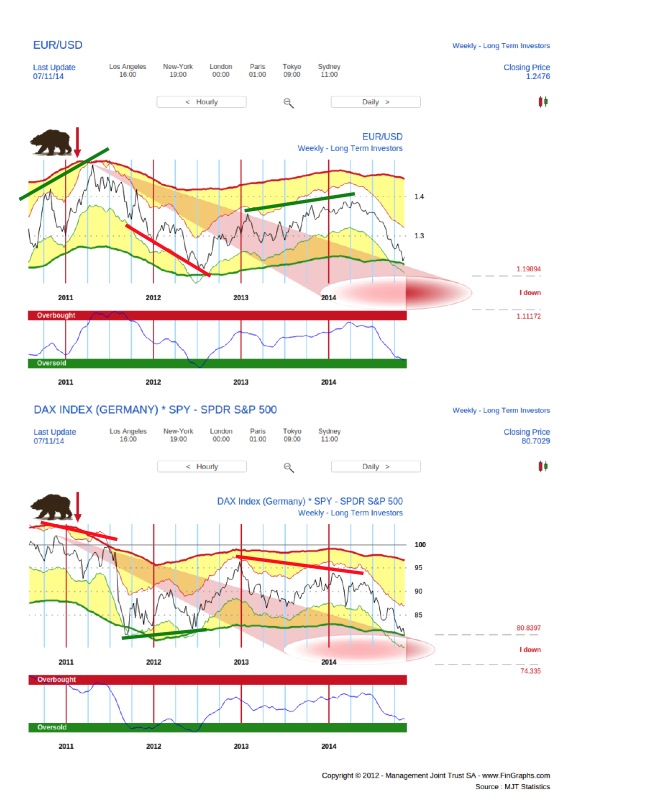
Although this may be just a coincidence due to other underlying factors, it is amazing to note that divergences between this ratio and EUR/USD have been remarkably consistent in anticipating EUR/USD turning points. Further, if you look even more closely, you will also find that most turning points in EUR/USD since mid 2011 were also preceded one to three months ahead by similar turning points in this ratio. The market seems to be discounting the attractiveness of both zones ahead of the currency specialists.
Hence, in order to buck its underperformance, the DAX will first need to reinstate an uptrend on a ratio basis (a hedged basis). This in turn could lead to a strengthening of EURUSD and, only then, will the DAX’s attractiveness vs SPY be reinstated. German exporters may hence have to wait a while before their share price can rip the benefits of the plunging EURUSD pair.
For more information on our methodology click here (http://www.fingraphs.com/#couponid-STKCHARTS14) and then visit ‘About Us/Press release’ and ‘User Guide’ sections of our website. Clicking that link also qualifies you for a 7 day demo and a 10% discount on our services if you choose to subscribe.
Have a great weekend, J-F Owczarczak (@fingraphs)