
Monitoring purposes SPX: Closed at 2043.94 on 12/31/15; long SPX on 11/2/15 at 2104.05
Monitoring purposes GOLD: Long GDX on 11/20/15 at 13.38.
Long Term Trend monitor purposes: Flat

The bottom window is the 5 day TRIN and readings above 1.45 are a bullish sign for the market and today’s close came in at 1.55. Next window up is the 5 day TICK and readings below -200 are a bullish sign for the market and today’s reading came in at +91.73. When both the 5 day TRIN and Ticks come in at bullish levels a high confidence bullish signal is triggered. The red vertical lines show when both the 5 day TRIN and Ticks are in bullish levels. Currently the 5 day TRIN is in bullish levels but the 5 day Ticks are not. Yesterday’s decline appears to have been a “Selling Climax” day and most are tested. If the test does materialize and panic ticks are recorded, we could end up with a short term bullish signal with a target back to the previous high near 207.50 on the SPY. We are neutral for now.
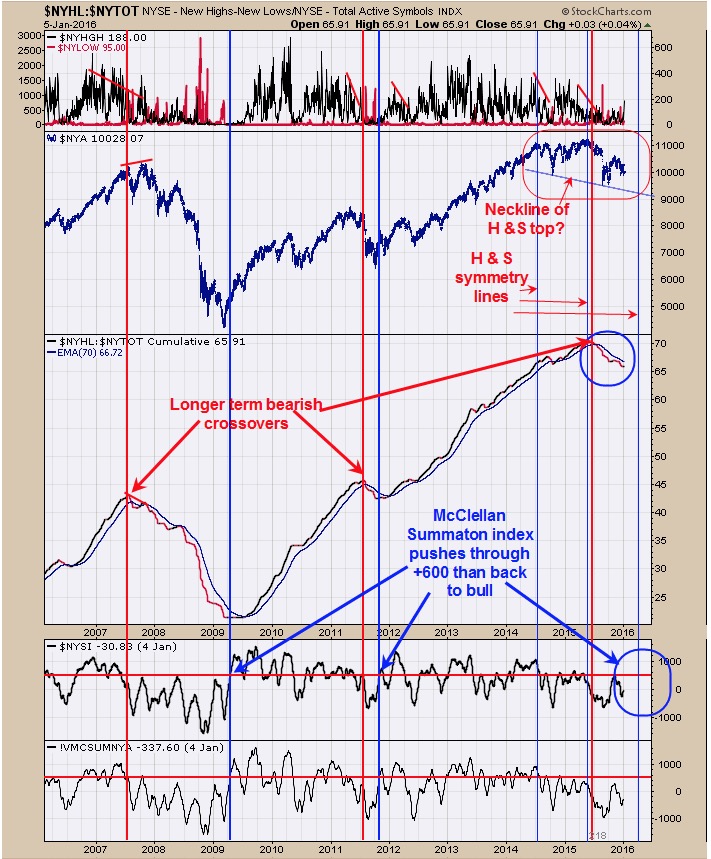
The Cumulative NYSE high low/NYSE total issues traded remains on a bearish crossover since May-June 2015. To change the trend back to bullish the NYSE McClellan Summation needs to rally strongly back above +600. Current reading is -30.83 and in a weak position. The light weight blue verticals lines represent symmetry time lines of a potential Head and Shoulders top where the Right Shoulder in time will be about equal to the Left Shoulder in time. Therefore the very right weak blue line coming in around April (potential Right shoulder) would have symmetry in time to the Left Shoulders. Since Head and Shoulders tops have symmetry in price as well, the market could have plenty of up and downs between now and April to complete the Right Shoulder and will look similar in price to the Left shoulder. For very short term as per page one there is a possible bullish setup if ticks reach panic levels on a test of yesterday’s low.
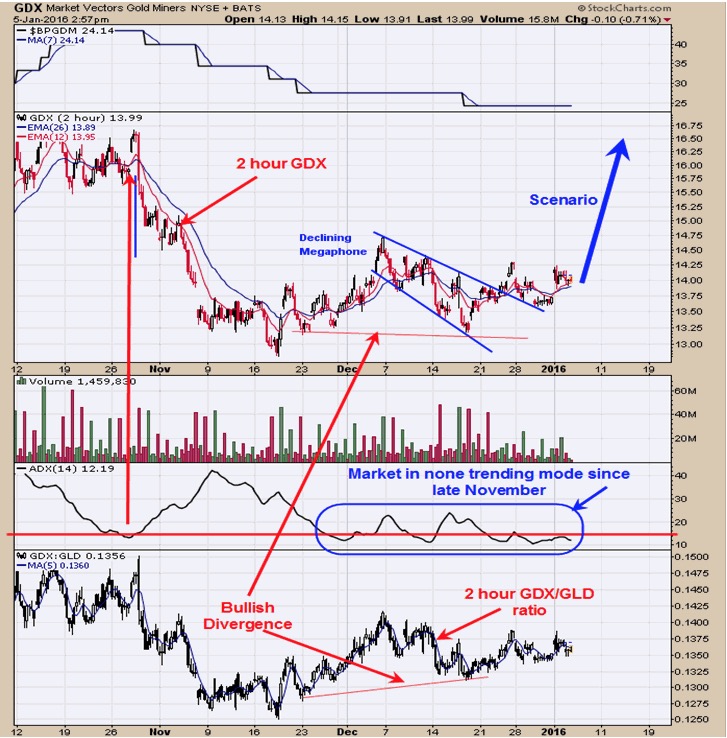
The Gold Commercials came in at -15,335 at the last reported December 29. Commercial COT readings below 50K short is bullish for gold. The Commercials have been below 50K short since mid November and the time that GDX has been basing. Above is two hour chart of GDX. The bottom window is the GDX/GLD ratio. Its bullish for gold and gold stocks when this ratio is showing a positive divergence against GDX and this is what occurring suggesting the next move will be up for GDX. Next window up is the ADX (average directional index). When ADX is low and moving sideways it shows the stock is in a none trending mode. When ADX starts to rise than the stock is about to start on a trend but doesn’t tell you what direction. With the COT commercials at bullish levels since early November and a bullish divergence is present on GDX/GLD ratio, the expected coming trend will be up. Long GDX on 1/20/15 at 13.38.
Tim Ord,
Editor
For examples in how "Ord-Volume" works, visit www.ord-oracle.com. New Book release "The Secret Science of Price and Volume" by Timothy Ord, buy on www.Amazon.com.