
This week we revisit Europe’s equity markets. Indeed, following our contribution last week where we selected 16 ETFs for a dynamic global portfolio, some readers did highlight our limited European Equity exposure (1 single European Equity ETFs: EXS2 iShares TecDAX UCITS ETF). Fundamentally, we would agree that there are some reasons to be more optimistic on Europe: Oil has halved, the Greek dilemma has been postponed, the ECB has launched a massive bond buying program and economic data is improving. That said, from an international investor’s perspective, in USD denominated terms, our FinGraphs trend positioning cannot confirm a medium to long term reversal yet. The Investor’s View chart below explains why. An Investor’s View is a combination of a Weekly, Daily and Hourly chart. It is meant to give an at a glance perspective of how trends could interplay over the next few quarters, months and weeks.
Investor’s View:
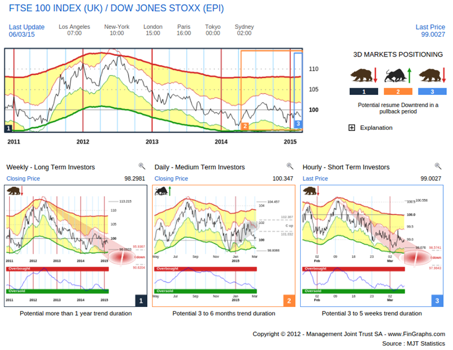
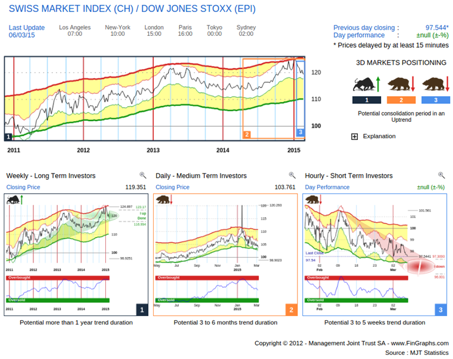
Dow Jones STOXX European 600 Index vs iShares MSCI ACWI Index Fund (in USD)
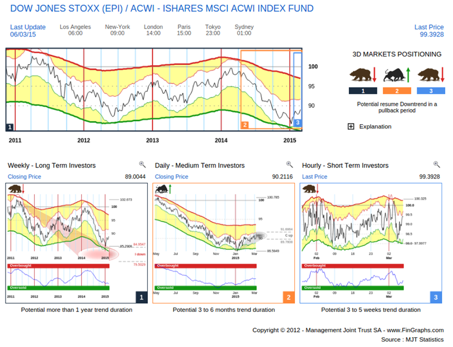
Our Weekly (left hand chart) still shows some downside price potential over the next few quarters. Its Risk Index (bottom panel) is not yet Oversold. On the Daily (middle chart), the move up since January is only a correction for now (labelled “C up” and coloured in grey). The Hourly (right hand chart) is neutral (Bear trend, but with no target). Hence, as long as the Daily (middle chart) cannot accelerate above its corrective targets (above the grey oval), the move is considered a mere correction and shouldn’t endanger the Weekly downtrend.
That was the picture in USD terms against ACWI.
Let’s now consider the Dow Jones Euro STOXX 600 vs the same ACWI, but on a hedged currency basis. We have purposely chosen the Euro STOXX rather than the European STOXX. It focuses on Eurozone stocks only and excludes other European countries. Hence, hedging it for the recent drop in EUR/USD, at its lowest level in a decade today, should be very beneficial to its recent performance.
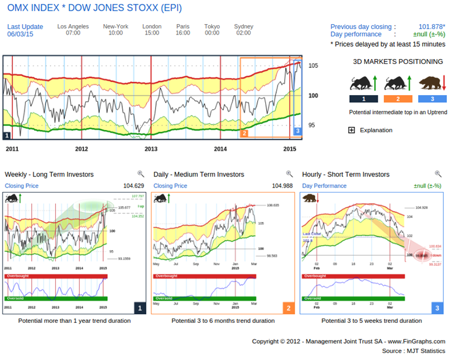
Investor’s View: Dow Jones Euro STOXX 600 Index vs ACWI (hedged ratio)
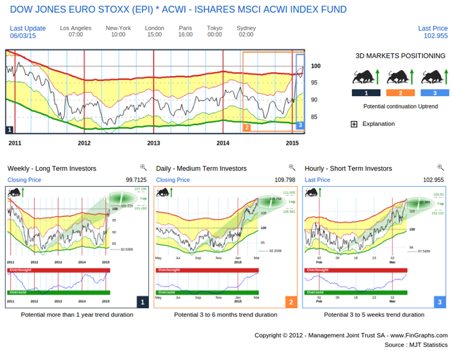
The picture is indeed quite different and there should be value in considering the Euro STOXX 600 vs ACWI on a hedged ratio basis. The Weekly (left hand chart) is in an impulsive Uptrend (green price projection). Although its Risk Index is in the initial stages of an Overbought position, price target potential is still very promising. Risk/Reward is hence interesting over the next few quarters. On a Daily and Hourly basis (middle and right hand chart), both prices moves are more advanced. They are approaching their impulsive targets up (green ovals), their Risk Indexes however are not yet Overbought. Hence, although their price projections offer limited potential, they should continue to trend upwards respectively over the next few months and weeks.
Based on this positive acknowledgment, we will now review a selection of European markets from a European investor’s perspective. We will compare them vs the European STOXX or the Euro STOXX depending if they are part of the Eurozone or not. We will then take an international perspective and benchmark them against ACWI and SPY (the S&P500 SPDR ETF). Europe has many markets and a half a dozen currencies, so we will present a lot of charts. We will try to let them do the talking and keep our comments to a minimum.
One last guidance, we are considering an investment horizon over the next 1 to 2 quarters, best reflected by our Weekly charts. We will consider a trend based approach rather than attempting to bottom fish initial points of exaggerations.
Weekly charts - Northern Eurozone vs the Euro STOXX 600:

The German DAX, the Amsterdam AEX and the Irish Stock Exchange are in uptrends on a relative basis. We will consider them individually below. We will dismiss France’s CAC40, which despite its rebound from recent exaggerations (Oversold Risk Index, both envelopes touching each other to the downside), is still negatively positioned with more downside potential vs the Euro STOXX 600 over the next few quarters.
Investor’s View - DAX vs Euro STOXX 600:
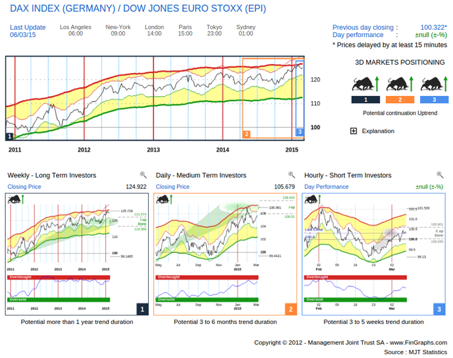
Although the DAX bit extended vs the Euro STOXX 600 on its Weekly chart (it has reached its impulsive target up, labelled “I up done”), the Daily still shows upside potential and the Hourly could soon turn “Impulsive up” again once its makes it above its corrective targets up (grey oval).
Investor’s View – Holland AEX vs Euro STOXX 600:
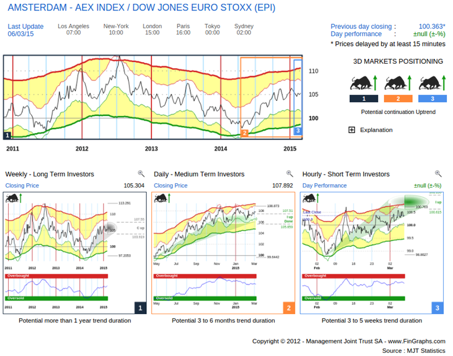
AEX vs Euro STOXX 600 has consolidated since November. It is hitting against the resistance of its Weekly corrective targets up (grey oval). The Daily is a bit extended (“I up done”), but its Risk Index has come down nicely since its tops. We believe it may be ready to accelerate again and turn impulsive (above corrective targets up) on the longer term Weekly trend. Indeed, the risk index is still quite low and trending up on this frequency.
Investor’s View – Irish Stock Exchange vs Euro STOXX 600:
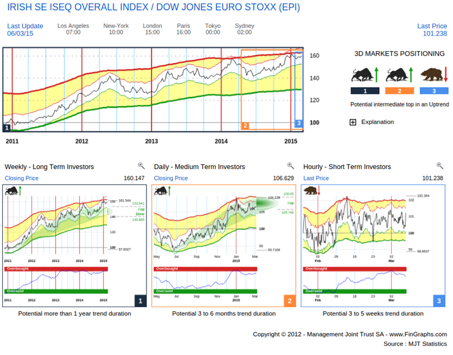
The ISEQ has consolidated vs the Euro STOXX 600 since the begging of 2015. The top in early January was probably an intermediate one as the Daily still shows some potential. The Weekly is extended (“I up done”) but still trending up.
Weekly charts - Southern Eurozone vs the Euro STOXX 600:
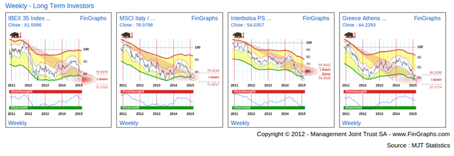
Four Weekly downtrends here vs the Euro STOXX 600. We will consider the Spanish IBEX (first chart), which appears to have resisted the best as well as the Portuguese Interbolsa (third chart) as an example of possible non actionable bottom fishing opootunity.
Investor’s View – Spanish IBEX vs Euro STOXX 600:
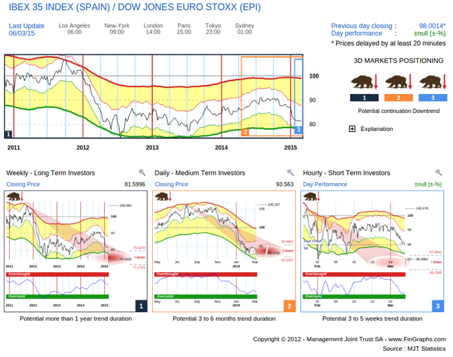
There is still downside price target potential in these three Bear trends vs Euro STOXX 600. None of the Risk Indexes are Oversold either.
Investor’s View – Portuguese Interbolsa vs Euro STOXX 600:
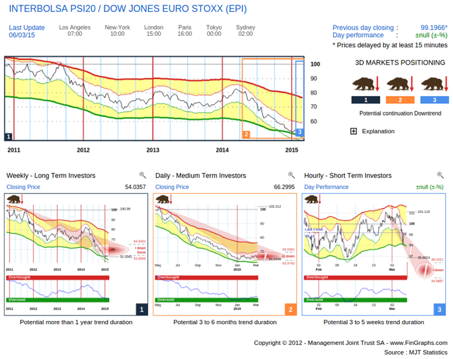
Although quite extended on its Weekly and Daily charts vs the EURO STOXX 600, there are no signs of reversal yet.
Weekly charts – Eastern Europe vs the European STOXX 600 (not hedged), Austria vs the Euro STOXX 600:
We have included Austria is this selection as its economy is heavily exposed to Eastern Europe, its banks especially.
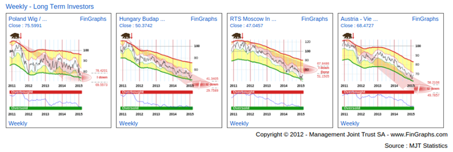
Four Weekly downtrends vs their respective reference indexes (European STOXX or Euro STOXX), we will move on.
Weekly charts – Western Non-Eurozone, Nordic vs the European STOXX 600 (not hedged):
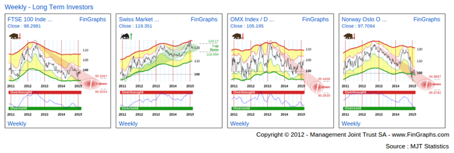
We will consider the UK FTSE which remain negative despite GBP’s appreciation vs the Euro, Switzerland’s Market Index in light of the Swiss National Bank decision to drop the floor and the Swedish OMX, which although still in a downtrend vs the European STOXX 600 could provide some opportunity on a hedged basis given its central bank’s early and aggressive monetary easing. We will dismiss Norway’s Oslo Bors which is heavily impacted along with the Norwegian Krone by the drop in the Oil prices (limited opportunity even on a hedged basis). Below, we will have a quick look at their currencies against the Euro.
Weekly charts – Euro vs GBP, CHF, SEK and NOK
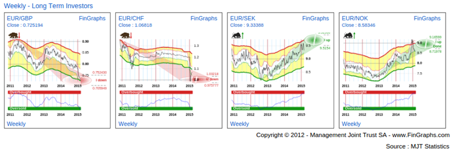
The Euro is still trending down vs GBP and CHF and up vs SEK and NOK.
Investor’s View – the UK FTSE Index vs European STOXX 600 (not hedged):
Despite the strong GBP vs the Euro, the FTSE is still trending down vs the European STOXX 600 on a non-hedged basis. The Weekly chart still has downside price target potential. The Daily chart may have completed its correction up. The Hourly chart is resuming the downtrend.
Investor’s View – Swiss SMI vs European STOXX 600 (not hedged):
The SMI Weekly chart is still trending up vs the European STOXX 600 on a non-hedged basis. It is however extended in terms of targets (“I up done”). Since the Swiss National Bank decision, the Daily and Hourly have however turned down. The CHF vs EUR revaluation may be gradually affecting the perspectives of Swiss exporters (the EUR/CHF bounce back from parity to 1.06 is not accompanied by an equivalent outperformance in Swiss Equities). We would stay away for now.
Investor’s View – Swedish OMX vs European STOXX 600 (not hedged):
The Weekly is in a strong uptrend vs the European STOXX on a hedged basis (the currency being weaker than the Euro, there may be an opportunity here to hedge out the currency effect). The Risk Index is just entering the Overbought zone and there is some price potential left. Yet the daily is now neutral (Bull trend with no targets) and the Hourly has started to reverse. The timing is not ideal.
We will now look at all the indexes above vs ACWI on a hedged basis or consider the perspective from an international perspective on a pure performance basis (no currency effect).
Weekly Mosaic – all indexes vs ACWI (iShares MSCI ACWI Index Fund in USD): hedged
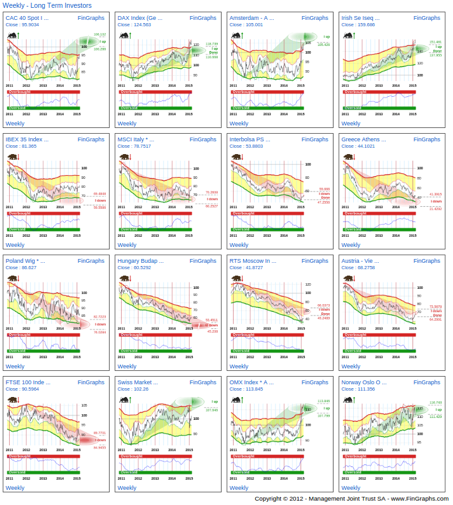
At this stage, positive trends vs ACWI on a hedged basis can be identified in France, Germany, Holland, Ireland, Switzerland, Sweden and Norway.
When compared to the SPY (The S&P500 SPDR ETF) however (a US perspective), the number of opportunities is heavily reduced.
Weekly Mosaic – all indexes vs SPY (the S&P500 SPDR ETF)
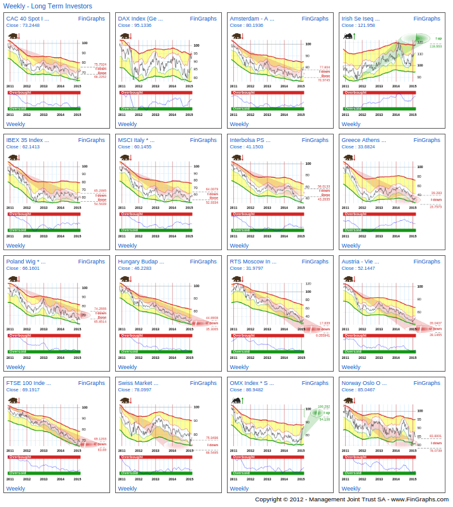
Ireland and Sweden are still positive. Germany is neutral (negative trend, no targets). Given its recent price move, it may turn positive soon. As it is the biggest European market, we will have a closer look at it below vs SPY.
Investor’s View – German DAX vs SPY (hedged):
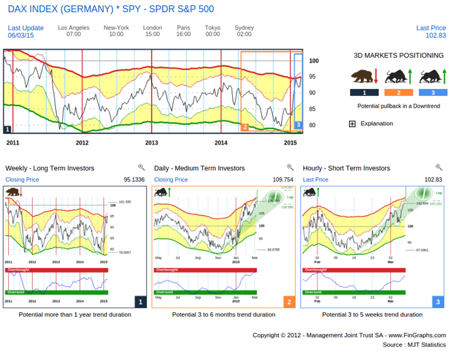
The Weekly chart is neutral (Bear trend, no targets), but could turn positive soon given the strong price move. The Daily and Hourly trends are positive and still have potential in terms of price targets and time. Now with EUR/USD falling like a knife, it is essential to hedge this position for now as the non-hedged Investor’s View (EWG vs SPY) is less appealing.
Investor’s View – the iShares EWG MSCI Germany Index Fund vs SPY (both in USD):
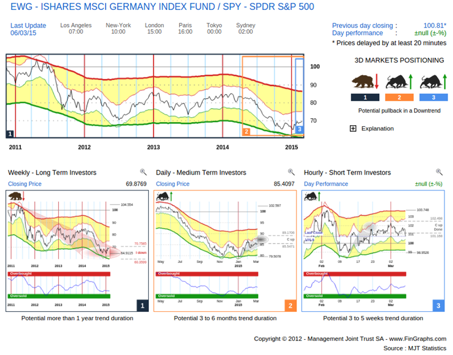
The Weekly chart is still in a downtrend with more price potential down and the Risk Index not yet Oversold. Both the Daily and the Hourly charts are in mere corrections up (grey targets ovals).
So we gave Europe a chance and at this stage, there are a few pockets of potential outperformance (positive Weekly trends on a hedged basis vs ACWI and SPY). Going forward and despite the Euro’s massive sell-off, we would still strongly advocate to continue hedging the currency risk out for now.
For more information on our methodology click here (http://www.fingraphs.com/#couponid-STKCHARTS14) and then view the Introduction slide-show and visit the ‘User Guide’ section on our website. Clicking that link also qualifies you for a 7 day demo and a 10% discount on our services if you choose to subscribe.
Have a great weekend, J-F Owczarczak (@fingraphs)