
List of Differences Between Upside & Downside Candlesticks
During an Intermediate Term Correction caused by several major industries in an industry cycle bear market, momentum sell down runs can be a lucrative trading method for Swing, Day, and Momentum traders who know how to Sell Short or trade “put” Options.
Few technical and retail traders know how to sell short properly. Often they use outdated strategies that no longer function optimally in the automated markets. Also most assume that the upside and downside are mirror images, which is a continuing myth that creates whipsaw sell short trades and meager gains.

The anatomy of a Sell Down Momentum Run is different than an upside momentum run in several ways. Here is the list of differences between upside & downside candlesticks:
1. The downside momentum run moves at a steep Angle of Descent™
2. There are fewer resting days
3. Candles tend to lengthen, rather than shorten due to stop losses triggering
4. Buy to Cover and Buy on the Dip orders create bounces that are bigger one day price action than profit taking candles on the momentum upside runs
5. Unlike the upside runs which require stronger volume as the stock moves up, the downside runs will fall on lower volume
To understand why the anatomy of a Sell Down Momentum Run price action behaves the way it does on the downside, technical and retail traders must first understand the driving forces behind the momentum run down. It is entirely different than an upside momentum run.
In an uptrend, the driving force is that all 9 Market Participants WANT price to move up. In a downtrend, only 3 Market Participants actively sell short. The remaining 6 Market Participants will either tolerate the downtrend as long term funds sell in panic, or Buy the Dip depending on who they are and their intent of the trade.
See the Anatomy of a Sell Down Momentum Run in the chart example below.
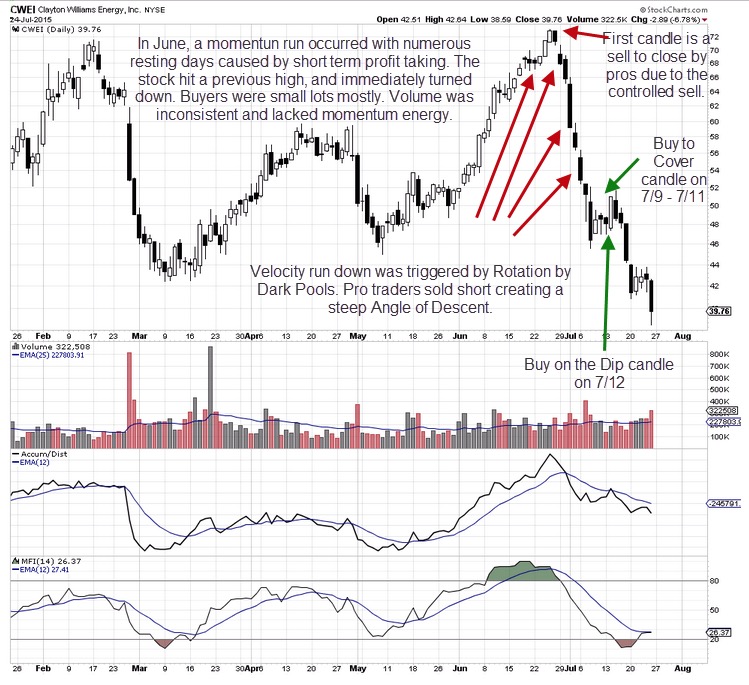
This chart example shows who is selling, who is selling short, which Market Participant Groups are Buying the Dip assuming this is not an Intermediate Correction, and the Buy-to-Cover action by Professional Traders who sold short.
Each type of candlestick and volume bar, tells the technical trader a great deal about which Market Participant Group dominated at each stage of the momentum run down.
Dark Pools had started Quiet Rotation™ prior to the top, and their action is always very tight price patterns on below average volume as the selling is automated and incremental.
Professional Traders who were helping the run up, sold as price entered the technical resistance level from the prior high. The resistance price black profit taking candlestick is precisely placed, small, and exactly at the prior high. This is a technical candlestick created by technical Professional Traders.
The Dark Pools orders continued to trigger as the stock moved down the next two days. The longer black candlestick formed as stop losses triggered. Dark Pools ceased their selling due to an increase in volume.
Momentum from stop losses triggering and sell short pros drove price down further. Near the lows of May uninformed Buy the Dip strategy investors bought the stock moving it up temporarily. That action was followed by more selling which at this time was by disillusioned smaller lots. Professional Traders placed Buy-to-Cover orders the next day. Two resting day candles followed as Buy the Dip investors were unable to move price. On the third day a long white candle formed as Buy the Dip investors and retail traders bought. However the run down was not finished, and Professional Traders resumed selling short.
Summary
Retail and technical traders need to keep in mind that there are many traders, investors, and funds managers all buying and selling at the same time in anatomy of a Sell Down Momentum Run. It is not enough just to see a black candlestick and sell short. To have high profits selling short, an understanding of the dynamics of the downside run is critical for success.
Trade Wisely,
Martha Stokes CMT
www.TechniTrader.com
info@technitrader.com