
The Summation Index was invented by my parents back in 1969, as a companion to the McClellan Oscillator. But it was in more recent years that we refined our understanding of the importance of the Summation Index in revealing what lies ahead for the stock market.
To understand this important point, we need to explore and define a principle of rocketry known as “escape velocity”. This term is variously (and sometimes confusingly) defined as the velocity which a projectile needs in order to escape the gravitational field of a planet or other body, and/or the velocity needed to achieve stable orbit as opposed to falling back down to Earth. My purpose here is not to defend either definition; for our purposes, the idea is the same, that there needs to be sufficient energy to keep from falling back down.
The Summation Index can show us that. For this discussion I will be using the Ratio-Adjusted Summation Index (RASI), which factors out changes in the number of issues traded. We still use the classic version of the Summation Index for some purposes. But for long-term time periods, where there can be a significant change in the number of listed issues, the RASI gives comparable amplitude levels with which to evaluate available financial market liquidity.
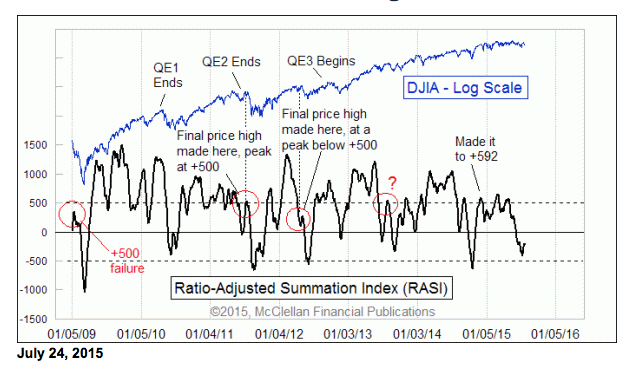
The +500 level for the RASI is the important go/no-go threshold for this concept of “escape velocity”. If the RASI dips down and then is able to climb back up above the +500 level, then that act assures us that there are further upside objectives ahead. Prices may dip in the meantime, but the basic rule is that a bull market is not done if the RASI can still climb back up above the +500 level.
Since the 2009 bottom, the Federal Reserve has made sure that there was liquidity available to the financial markets, at least for the most part. The cutoffs of liquidity after both QE1 and QE2 led to vacuums in the banking system, and stock prices fell into those vacuums. The question for 2015 is whether Fed actions are going to take away the liquidity punch bowl, and create a problem for the next rally’s ability to achieve escape velocity.
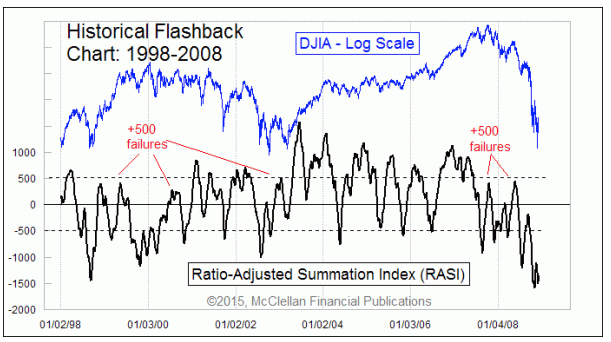
We saw this principle of diminished liquidity back in 1998-2000, and again in 2007-08, as highlighted in this historical chart. When the RASI failed to climb back up above +500, it said that there were liquidity problems which ended up keeping the stock market from being able to continue itself higher.
Turning back to the current chart above, the last upward surge for the RASI was able to get back up above +500, barely. But now we have seen a relatively minor price dip for the DJIA and SP500 while the RASI has made a pretty significant dip. My leading indication from the eurodollar COT data says that we should expect a major top in August 2015, and so there is not all that much time left for the RASI to get back up above +500. An upturn from this oversold condition should be able to produce a marginally higher price high, but if it cannot produce a RASI reading above +500, then we will know that the end has arrived for the bull market.
The mid-year rankings from Timer Digest are out now, reflecting timers' performance as of June 30. A recap is available on our Home page. Worth noting is that I am currently the only timer in the top 5 of all 3 categories, stocks, bonds, and gold. The rankings are based on the "intermediate" term opinions published in our Daily Edition.
Tom McClellan
The McClellan Market Report
www.mcoscillator.com