
Rationales & Targets
While the bear camp has indeed expanded in recent weeks, the shift in bias has been quite modest and there seemed to be precious little in the way of actual capitulation on the trading floor, thus we must presume this is only the first leg down of a much larger correction. As well, the financial media remains far too bullish to pin hopes on a resumption of an already old six year bull market. The most compelling reason for bulls offered recently was high dividend stocks offering “value plus income,” but it only takes a further 4% decline to wipe out the benefit of a good annual dividend. Valor has no place at this time. On the other hand, discretion requires patience. We’ll take patience.
Potential problems stemming from further currency devaluations in China and elsewhere, as nations compete to export goods, imply serious risks ahead. China’s exports fell 8.3% in July and their economy clearly seems to be slowing. Perhaps one can write off problems in Greece as the country’s impact is small but China’s economy is as large as the U.S. If China catches cold, we will all be sneezing.
At best, we could see modest positive action through the Labor Day holiday but we expect the remainder of September to provide more evidence that the six-and-a-half year bull market is over, complete, kaput, stick a fork in it—it’s done. A much better buying opportunity lies somewhere ahead and we are not holding our breath. We fear the present.
The Mother Of All Churns
- A free three issue trial to Crosscurrents is available upon request -
We routinely tally total dollar trading volume (DTV) every month and each time we have done so, the number has run to a new all time record high. Given stock manias im 2000 and 2007, how can these new records be interpreted as anything other than yet another mania? While the public is clearly not as involved as before, the numbers are nevertheless truly staggering and strongly imply professional participation on an awesome and historic scale. For the first time in history, annual dollar trading volume is running at a rate of over $70 trillion, or roughly $278 billion per trading day. Compared the amount to the average $48.5 billion in GDP generated every day and it is easy to infer the primary business of America is stocks. No wonder the economy is always suspect. It is not about generating sales of goods and services, it is all about the creation of wealth, or at least the illusion of wealth.
While DTV versus gross domestic product (GDP) is off roughly 10% from the high achieved in 2010, we’re still at levels that can only be interpreted as manic. Several years ago, we drew a line across the chart at the same level achieved in 1929 as the Roaring Twenties insanity peaked, in order to illustrate the scope of what has occurred in the present era—ruled by technology. Thus, we are making the case that every year from 1997 may fairly be presumed manic in nature. However, there has been a sea change. After the twin 50% price collapses in 2000-2002 and 2008-2009, the public has apparently (and correctly) decided they’ve had enough. Unfortunately, a mania is a mania is a mania and if professionals are caught up in the nonsense, they will also eventually pay the price. It’s easy to believe that Bear Stearns and Lehman Bros. were one-offs but we would not be at all surprised to see far worse events as the dénouement unfolds.
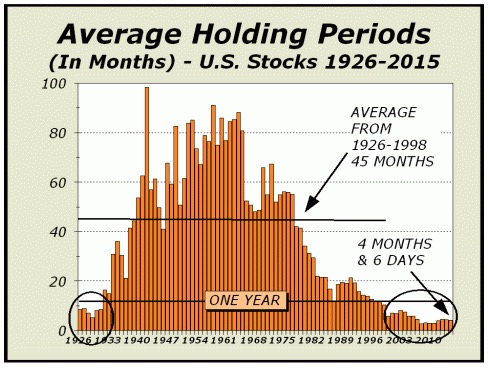
The nature of the stock market has completely changed from an investment arena to a factory of churn. Holding periods are impossibly small to consider the theme of investment. As we illustrate in the chart at lower right, for the 73 year period from 1926 to 1998, holding periods averaged 44 months and 25 days, clearly sufficient to presume the overriding theme was investment in the future. We should also look the post war years of 1946 to 1972, one of the greatest boom periods in the nation’s history as the average holding time for stocks ballooned to nearly 70 months. However, from the tech mania peak, holding times have averaged a mere five months and as of our most recent tally, were currently averaging only four months and six days. The investment market has been replaced by a trader’s market. When we got to the point where Nasdaq’s average P/E reached 250, the lesson was don’t pay attention to value, you can make money quicker by speculating. In the next manic phase when margin debt exceeded the 2000 record high by 39%, the lesson was don’t pay attention to risk, lever up and make money even quicker.
On a typical day, between $250-$300 billion of stocks are traded. On Monday, the figure ballooned to nearly $636 billion. Of course, it wasn’t all high frequency or program trading, some of it was likely Mom & Pop being triggered out of a stop loss order that seemed like a decent idea at the time, a just in case. What Mom & Pop forgot about was the possibility of another flash crash and the order being triggered far below what seemed to be reasonable assumptions. In five minutes, the Dow gave up 1094 points and the public received additional proof that the stock market is completely tilted against them. The theme of investment is dead; the stock market favors only those who ply mechanical means of trade.
For more information, please contact us:
Alan M. Newman, Editor, Crosscurrents
www.cross-currents.net