
Identifying Stock Chart Bottoming Patterns
Early Swing and Position Trading Entries
Bottoming patterns are changing as the Market Structure for the institutional side evolves and changes. There are now many different types of venues and orders that are available exclusively to the professional side of the market.
That can be an advantage to Technical and Retail Traders who want to trade with these groups. Identifying stock chart bottoming patterns as they begin can aid in avoiding whipsaw Sell Short trades and missing out on the Velocity and Momentum Runs that occur in the early stages of a bottom development. It is also important for Position Traders who intend to hold the stock for several weeks to enter as the bottom completes, which many miss entering after the Uptrend is running.
The simplest way to identify a stock that is actually bottoming even though the final low has yet to be reached is to use indicators that are not Moving Average crossover based. Often times what reveals a bottom is underway are indicators that can identify Dark Pool Quiet Accumulation which often starts on the final leg down. This is because the Dark Pools identify a price range “Buy Zone,” and are attempting to buy large lots incrementally without disturbing the trend. However their incremental buying is so dominant, that it eventually eliminates the Traders who are Selling Short and the Investors selling in panic. Dark Pools create bottoms with their bargain hunting Buy Zone strategies.
Linear Slope is one of the indicators that can show an extreme pattern when identifying stock chart bottoming patterns, before price makes its final low. This early identification allows traders to put the stock on a watchlist, and monitor the bottoming progress. The process helps Momentum Swing Traders find the entries for swing action at the earliest possible entry. Every point matters for Swing Traders and Day Traders. Often Retail Traders are chasing a run, rather than stepping in to buy ahead of the run. Linear Slope is a center line oscillation indicator which shows an extreme pattern ahead of the final low.
In the chart example below of Qorvo Inc. (NASDAQ: QRVO) the Linear Slope Indicator in the bottom chart window, bottoms in mid-August and then forms higher lows as the stock reaches its final low as the bottom develops.
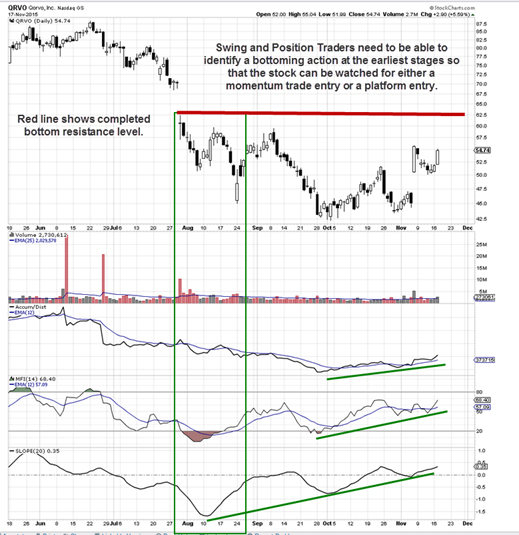
The Money Flow Index indicator MFI also shows the extreme pattern, confirming the bottom has actually started long before the final low.
Summary
Most Retail Traders chase runs, have a knee jerk reaction to price, struggle with chronic losses, a few good trades, and plenty of whipsaw action especially when attempting to Sell Short. By including indicators that show clearly that a bottom is underway, traders Selling Short can prepare for the reversal candle patterns. They can then get ready to Swing Trade the Momentum Runs that tend to run quickly up to the bottom completion resistance level, which is marked with a red line in the chart example.
Trade Wisely,
Martha Stokes CMT
www.TechniTrader.com