
Monitoring purposes SPX: Neutral.
Monitoring purposes GOLD: Long GDX on 11/20/15 at 13.38.
Long Term Trend monitor purposes: Flat
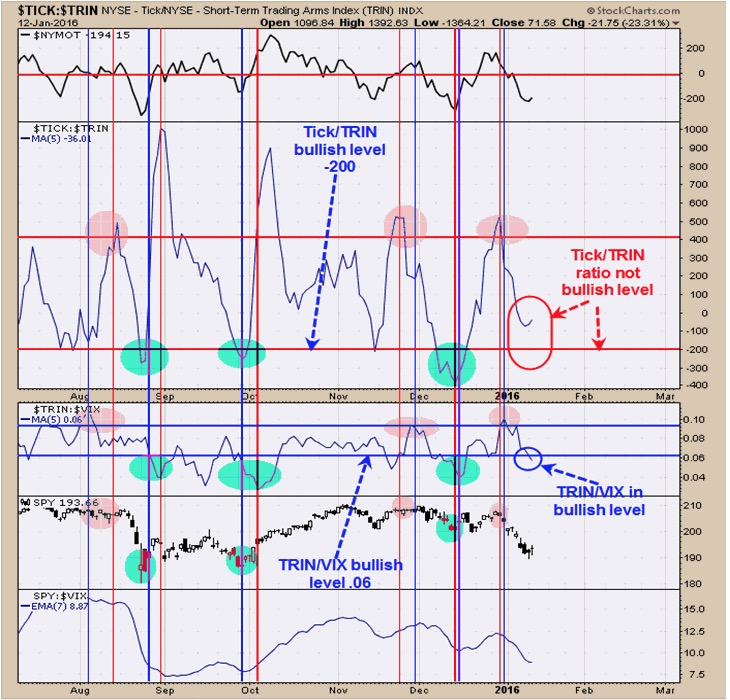
Panic is what makes bottoms in the market and we measure panic using the TRIN and Tick readings. We also have other measure that help define panic which is the Tick/Trin ratio with a 5 period moving average and TRIN/VIX ratio with 5 period moving average. The TRIN/VIX ratio is in bullish territory but the Tick/Trin ratio is not. The “State of the Union” address is tonight and could affect the market short term. It appears a bottom is near by and the “State of the Union” address could put the necessary panic in the Ticks before the week is out. We are neutral for now.
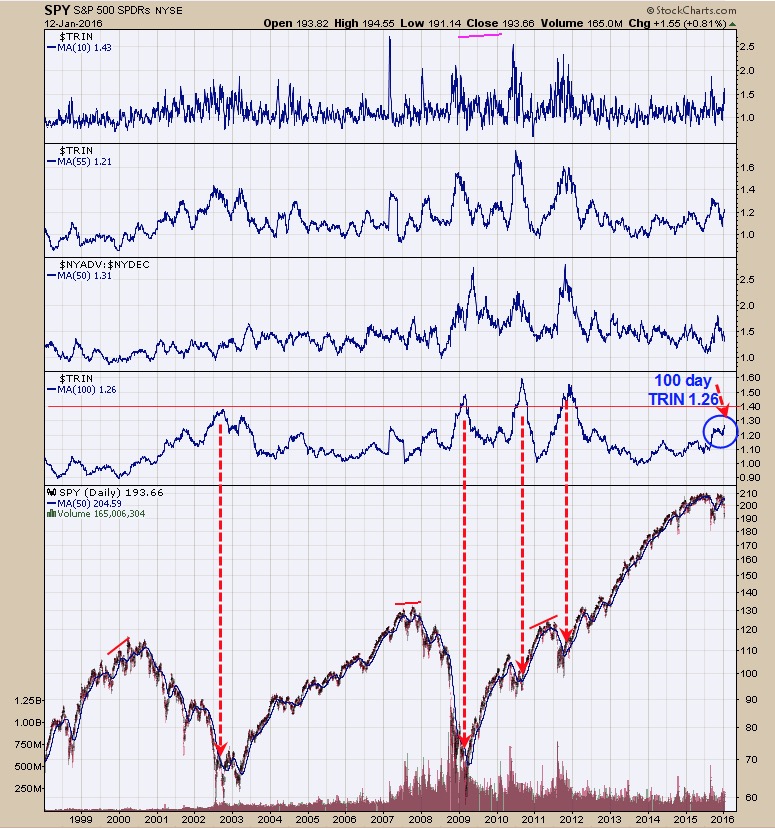
The chart above looks at the bigger picture and helps to define where we are in a declining market. The window above the SPY is the 100 day moving average of the TRIN. The chart goes back to 1998. When there is panic in the market the TRIN rises and the length of time the TRIN stays high the higher the reading for the 100 day TRIN. So ideally to shorten a bear market a quick rise to above 1.40 on the 100 day TRIN is needed. The decline of 2010 and 2011 saw a rapid rise in the 100 day TRIN above 1.40 and a short (in time) bear market. Current reading on the 100 day TRIN is 1.26 and rising. On 12/28/15 post we showed bearish crossover of the NYSE New highs/New lows/ NYSE Total issues trading than using a cumulative indicator and suggested a bear market. As long as this bearish crossover persist the bear is dominate. We bring this chart up as it appears a bear is in force and as the bottom approaches the chart above will help us to find the next major low.
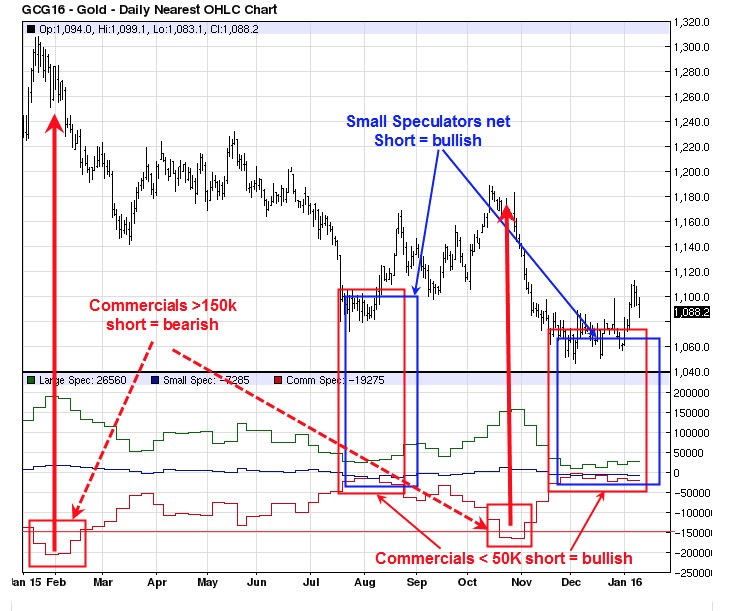
The Gold Commercials came in at -19,275 last updated January 5 (last weeks reading -15,500 range). Commercial COT readings below 50K short are bullish for gold. The Commercials have been below 50K short since mid November and the time that GDX has been basing. The above chart shows the commercials positions along with the Small Speculators positions. When the Commercials reach above 150K short then a short term top is likely in Gold (which occurred in February and October 2015). Bullish conditions are present when the Commercials are less than 50K short along with the Small Speculators net short. Those two condition where present at the Late July early August 2015 low and starting in Late November 2015 to the present time. Currently the Commercials are short 19275 contracts and the Small Speculator is net short 7285 contracts. The basing period in Gold has been going on since November and the longer the base usually the longer lasting the rally. It looked as though last week the break to the upside had begun, but it has since fell back in the basing pattern. We are still expecting a rise to begin soon. Seasonality wise January is usually an up month for gold. Long GDX on 11/20/15 at 13.38.
Tim Ord,
Editor
For examples in how "Ord-Volume" works, visit www.ord-oracle.com.
New Book release "The Secret Science of Price and Volume" by Timothy Ord, buy on www.Amazon.com.