
How to Identify Early “Shift of Sentiment™” Bottoms
One question every Trader is asking right now is, “When will this Correction end?” A better question is, “How do I determine a particular stock will soon start a Bottom Formation?”
Every Technical and Retail Trader knows that Bottoms are often completed with a Momentum or Velocity run, but few are able to capture that big gain because they are unable to recognize the patterns that precede it. Instead most Technical Traders chase the run, and either net a medicore profit or have a small loss instead of the big gains they wanted.
It is a simple matter of knowing what to look for during a Correction that will indicate BEFORE the momentum of a Short Term Bottom or Rebound, that the stock has hit a Dark Pool Buy Zone™ and will start a Bottom shortly thereafter. “Relational Analysis™” is what I call this early kind of identification.
The following are several factors to look for in a chart, which reveal Dark Pool Buy Zones:
1. Price action
2. Volume
3. Support levels
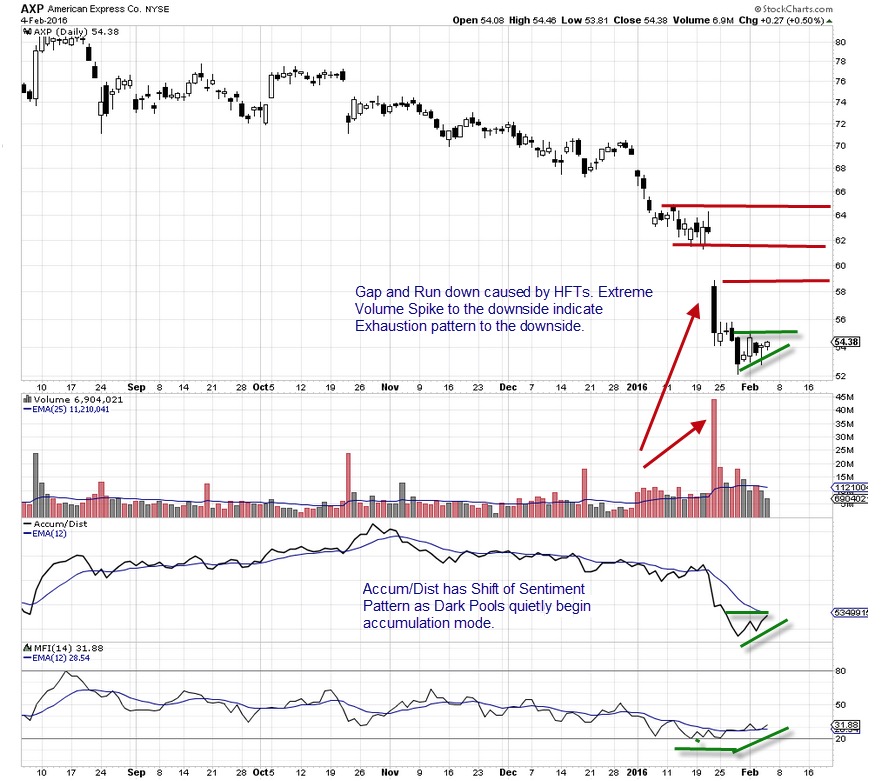
The chart example below is the American Express Co. (AXP: NYSE) and it shows one of the new classic Price, Volume, and Support patterns.
When interpreting extreme candlestick patterns using Relational Analysis, the following is the order in which to proceed with the chart analysis:
1. Look at Price first.
In this chart example after a huge gap and run down, price has shifted to an ever tightening Compression pattern. Compression patterns tend to form before a sudden breakout aka Momentum or Velocity run.
2. Next look at Volume.
In this chart example the huge extreme Volume spike on January 22, 2016 is another new but classic pattern, that forms as the stock plummets right into a prior Dark Pool Buy Zone. This is an exhaustion pattern on Volume to the downside. High Frequency Traders HFTs are computer algorithms that often drive price down into a Buy Zone. How price behaves after the price gap and run down on extreme Volume, is a key element in Relational Analysis.
3. Finally look at Support Levels.
Looking for Support is the technical aspect of this analysis. Price is holding at this level for a reason, and not by accident or coincidence. In addition, Price is compacting tightly for a reason. The Accum/Dist indicator has turned up after hitting the bottom of its indicator chart window, and the Money Flow Index MFI indicator is above its Exponential Moving Average EMA in the bottom chart window. Both reveal Dark Pool Time Weighted Average Price TWAP orders. TWAP is a specific type of order that triggers automatically over an extended period of time, creating a consistent pattern in Price action, Volume, Accumulation, and Flow of Funds into a stock.
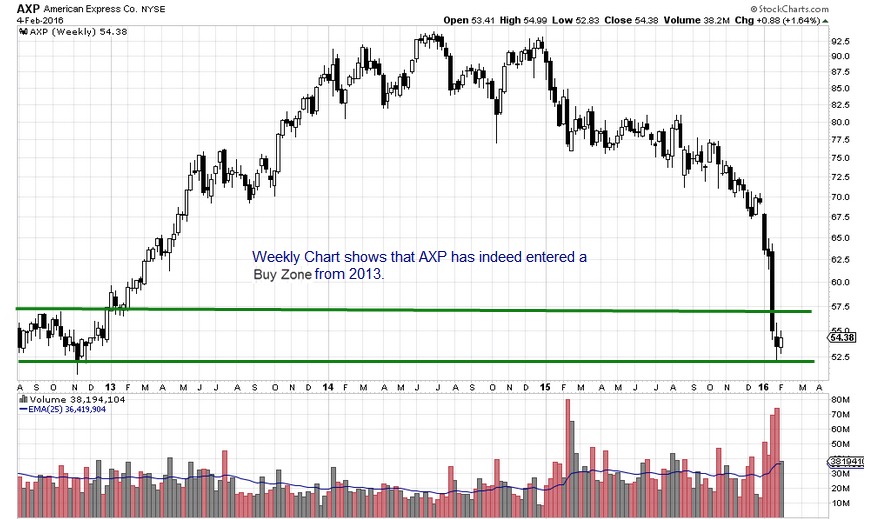
Below is a look at the weekly chart view of this stock example, which shows that it has indeed hit a Dark Pool Buy Zone.
Summary
Momentum and Velocity action out of an extreme bottom low are excellent opportunities for Swing and Day Traders. Using Relational Analysis to identify potential candidates early for momentum and velocity trading is best. Waiting until after the run has already begun can use up much of the Point Gain Potential, which lowers profits and increases risk.
For entries on these patterns a trader must also consider underlying Momentum, overall Market Bias for the entry day, strength of Indicators, Risk versus Point Gain Potential, Support for the Stop Loss, and points to Resistance.
Trade Wisely,
Martha Stokes CMT
www.TechniTrader.com
info@technitrader.com