
The trigger line, or trend line, abbreviated as the “t-line” is a leading indicator that closely tracks price and anticipates short-term price movement and correction.
It consists of an 8-day exponential moving average (8-EMA). Because the period of the average is short, a “normal” pattern emerges when the t-line tracks price closely. The significant signal occurs when price begins trading and closing above or below the t-line over a series of days. This strong run in price is a specific bullish (above) or bearish (below) signal.
As price moves farther away from the t-line, either above or below, the chances increase that the distance will close rapidly. The nature of averages makes this a certainty, although the time required varies with the momentum of a directional price trend.
A single session’s move above or below the t-line is not significant. The consistency of prices remaining above or below confirms the likelihood of a bullish (above) or bearish (below) short-term trend. As a strong and highly visible signal, the t-line strengthens indicators that serve as confirmation, including candlesticks, Western signals, volume and momentum.
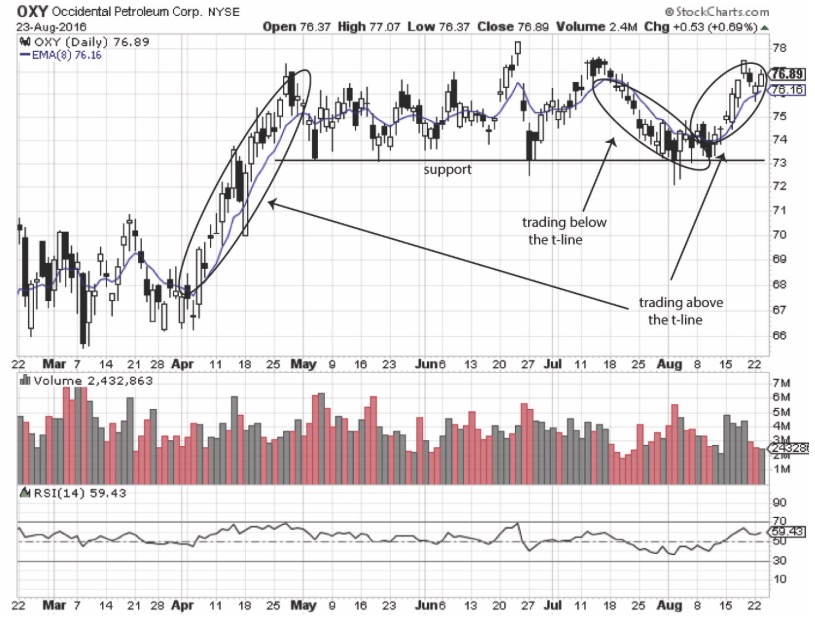
An example of how the t-line can be used to identify short-term trends is seen on the chart of Occidental Petroleum (OXY). The big run-up in April is extraordinary because prices closed above the t-line for 18 of 19 consecutive sessions. By its nature, the t-line and its 8-day average “normally” tracks price much more closely and tends to move back and forth from above to below price.
The second example is a downtrend, with prices closing below the t-line for 14 sessions. This was significant for a different reason. The price trend declined down to support but did not break through. At that point, in fact, price reversed and moved upward. As it did so, the price once again moved above the t-line and closed at that level through to the end of the chart.
This demonstrates that the t-line is a simple signal, but one that provides a lot of directional guidance. The status of price relative to the t-line serves as an indicator of momentum as well as likely timing for reversal or continuation in the trend.
When added to other technical signals such as candlestick reversals, volume, and momentum oscillators, the t-line is an added layer of reliable confirmation that every trader can use to better time entry and exit.
Michael Thomsett blogs at TheStreet.com, Seeking Alpha, and several other sites. He has been trading options for 35 years and has published books with Palgrave Macmillan, Wiley, FT Press and Amacom, among others.