
SPX Monitoring purposes; Covered short SPX 1/31/17 at 2278.87 =.09% gain; Short on 1/30/17 at 2280.90
Monitoring purposes GOLD: Long GDX on 12/28/16 at 20.25.
Long Term Trend monitor purposes: Short SPX on 1/13/16 at 1890.28
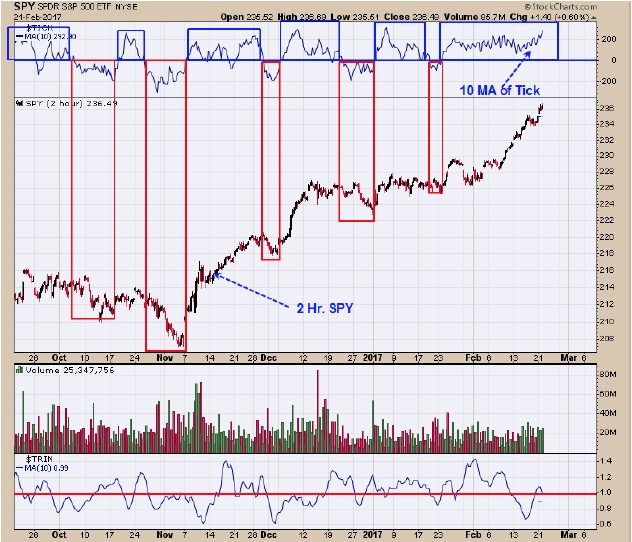
The 10 period average of the tick on a two hour SPY could hold the key when the current rally could end. The 10 period tick has held above “0” since late January and remains above “0” now suggesting the rally is not over. The VIX and Put/Call ratio are showing a negative divergence but momentum seems to rule this rally and the tick helps to define moment. RSI on the SPY is up in the 80’s which implies its late in the game for the SPY. Until the ticks turn down, the trend in the SPY will remain up. We will keep our powder dry for now. Follow us on Twitter @OrdOracle.
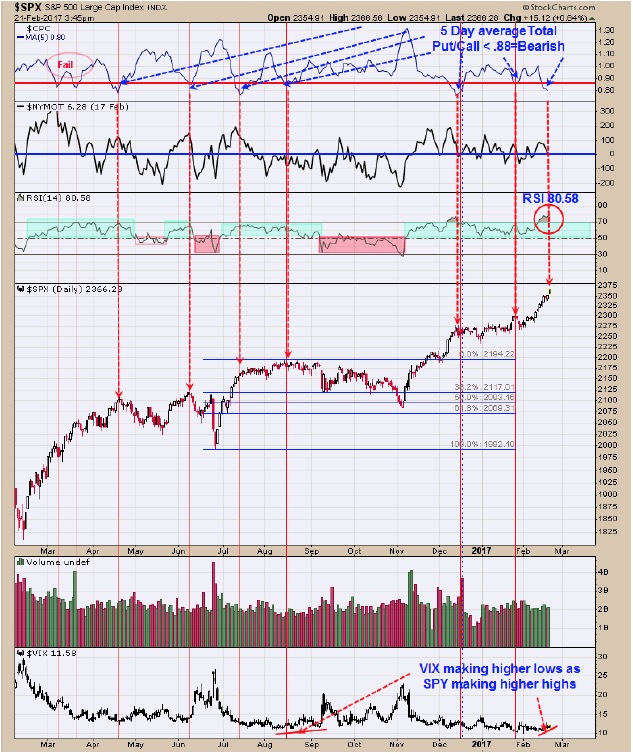 The top window is the 5 day average of the Total put/call ratio (CPC) and readings below .88 have appeared near market highs. Friday’s CPC 5 day average came in at .80 and in the bearish level. Next window down is the NYSE McClellan Oscillator which will close near +53 and above “0” which is still bullish. The middle window is the daily RSI. In uptrend in the market the daily RSI stays above 50 and in down markets it stays below 50. The RSI closed today at 80.58 and remains in bullish levels for the market but as high it normally gets and shows the market is extended. The bottom window is the VIX which as been making higher lows as the SPY has made higher highs which in the past has been a bearish sign for the market. The McClellan Oscillator remains above “0” and RSI is above “50” both of which are still bullish for the market. Momentum seems the name of the game for now and until its broke (which can come at any time), we have to say trend is up. The tick readings on page one may hold the key when momentum is broken.
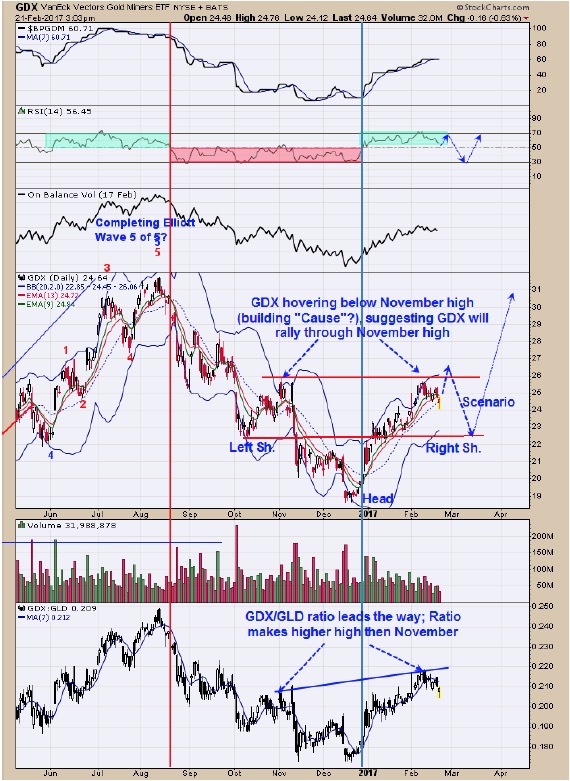 GDX has been hovering right below the November high (building “Cause”?) with out showing much price weakness. This condition normally produces a rally through this resistance area and is what we are expecting here. The bottom window is the GDX/GLD ratio which normally leads the way for GDX. GDX/GLD ratio made a higher high than the November high and suggests GDX will also. A short term “POP” may occur above the November high (near 26.00) and may stall and could be an exit point on our long GDX position. The pattern that may be forming on GDX is a Head and Shoulders bottom pattern and the Right Shoulder may form in the coming weeks. Long GDX on 12/28/16 at 20.25.
Tim Ord,
Editor
For examples in how "Ord-Volume" works, visit www.ord-oracle.com. New Book release "The Secret Science of Price and Volume" by Timothy Ord, buy on www.Amazon.com.