In going through my regular routine of macro indexes and breadth charts, I started to see some things that tend to happen before a correction. These three things range from the statistical to the anecdotal, but combining the three raises some concern.
Three things that suggest a correction may be imminent
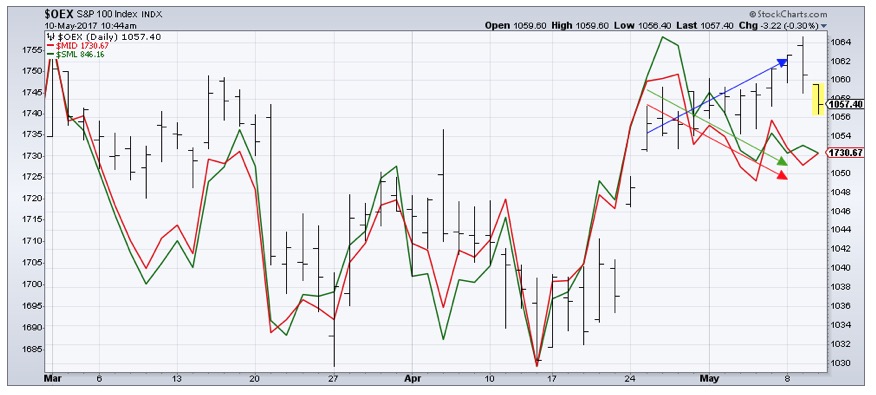
1) I noticed the divergence of small and mid caps from large caps in the US. I mentioned this in my blog yesterday and the chart below shows the divergence pretty well.
2) I often flip through a bunch of stock charts, starting with the largest and going from there. With technology being such leadership recently, I’m waiting to see any sign of weakness there as a potential warning sign. I noticed that while the tech sector overall has continued to show strength, the Facebook chart ($FB) has pulled back a bit. The two highest bars had closes below the open, and the highest bar was an outside day (higher high, lower low, down close).
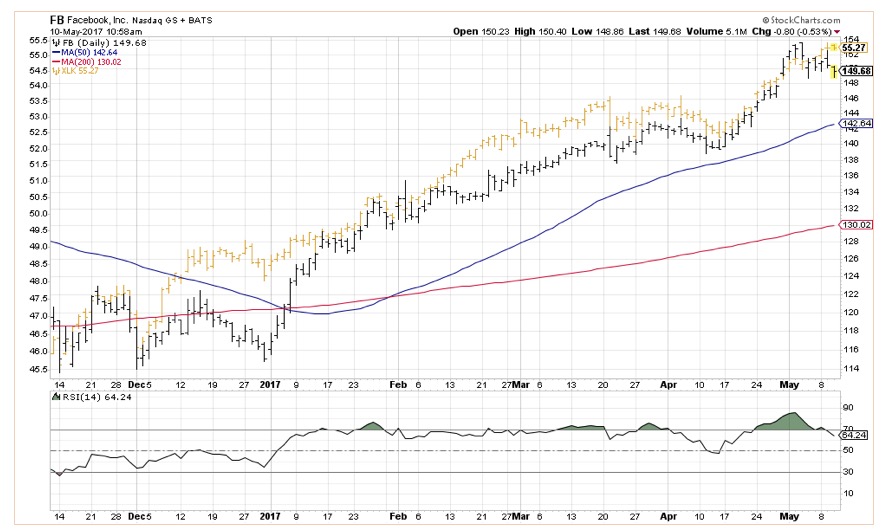
In the chart above, you see Facebook (black) selling off a bit while the tech sector (gold) has continued higher. While this alone doesn’t indicate overall weakness, it is just one warning sign that caught my eye,
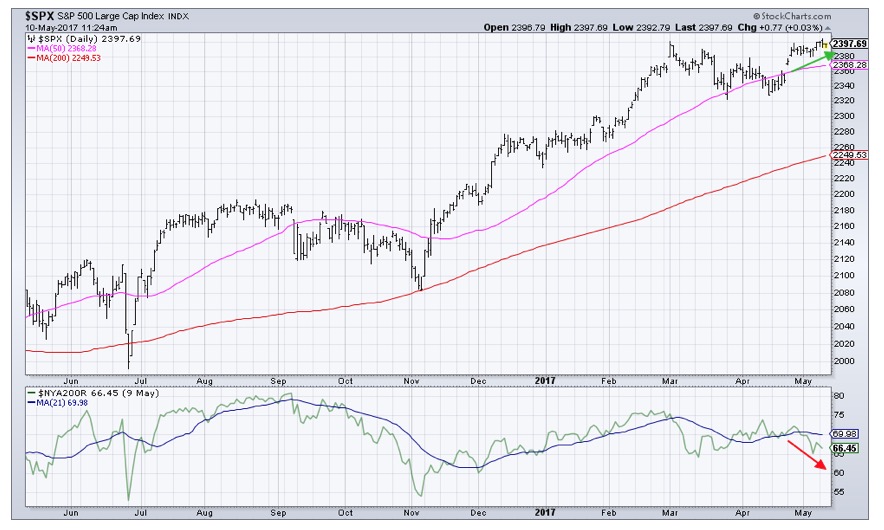
3) One of the breadth indicators I follow is the percent of NYSE stocks above their 200-day moving average. Again, not a huge “oh no the world is ending” type of indication, but a bearish divergence over the last two weeks that tells me to keep an eye on this chart.
Never base your analysis on the current price bar
One thing to keep in mind with charting (perhaps best illustrated with my first chart above with large/mid/small cap indexes) is don’t ever base your analysis on the current price bar. As the OEX sold off this morning (5/10/17), the latest bar looks fairly negative. And due to recency bias (see below), we will subconsciously assume that the next couple bars will be lower.
One of my mentors, long-time technical analyst Jeff Weiss, taught me to be patient and wait for daily (and even weekly and monthly) closes before you make any sort of decision. In his recent book, he advises against focusing on short-term price action, saying:
“Unfortunately, all too often folks read far too much into micro movements that run counter to the prevailing market trend. A question the technical analyst asks in situations like this is whether near-term movements have altered the supply-demand relationship for the stock (or market) in question beyond this minor trend horizon.”
Remember, if there would be huge rally in the afternoon, a bearish bar in the morning can quickly become a quite bullish bar at the close. Always wait for closes and confirmation before you complete your analysis.
Falling victim to recency bias
I recently discussed recency bias and how we are wired to assume what has happened most recently will continue to happen. While this can be somewhat helpful in longer-term trend following, it can trick us into putting way too much weight on short-term price fluctuations.
How do we fight this bias? Make sure you review multiple time frames. Monthly, weekly, daily, intraday charts have a place in our analysis, regardless of our investment time horizons.
So while the weight of the evidence remains positive for equities, I will be keeping an eye on these charts to gauge any potential correction.
David Keller, CMT
marketmisbehavior.com
David Keller, CMT is passionate about viewing the markets through the lenses of behavioral psychology and technical analysis. He is a Past President of the Market Technicians Association and currently serves as a Subject Matter Expert for Behavioral Finance. David was formerly a Managing Director of Research at Fidelity Investments in Boston as well as a technical analysis specialist for Bloomberg in New York. You can follow his thinking at marketmisbehavior.com.
Disclaimer: This blog is for educational purposes only, and should not be construed as financial advice. The ideas and strategies should never be used without first assessing your own personal and financial situation, or without consulting a financial professional.
